import pandas as pd
from prophet import Prophet
from prophet.plot import add_changepoints_to_plot
Source: Meta (2026b)
Prophet is an easy-to-use open-source forecasting library available in Python and R, developed by Meta (Facebook).
It is designed to handle time series with strong seasonality and holiday effects.
Prophet model structure
Source: HSMA (2024), Monks (2020)
Prophet models a time series as a sum of components:
- Trend
- Seasonality
- Holidays/special event effects
- Error (unexplained noise)
Additional regressors can also be incorporated.
Trend
Trend model
Source: Meta (2026d)
Prophet supports two models for trend:
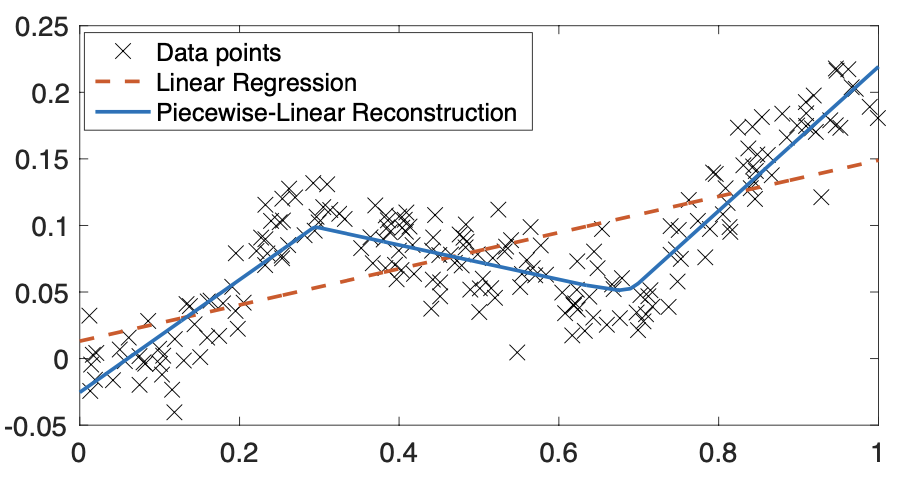
Piecewise linear regression trend model. Linear regression draws a straight line through a dataset. Piecewise linear regression will break the data into intervals and fits a line to each, each with their own slope. This makes it well suited to datasets where the underlying trend isn’t a single straight line but shifts direction over time.
Logistic growth trend model. This is used when there is a maximum value that can’t be crossed (known as the “carrying capacity”). This model will start to flatten the trend as it approaches that value.
Code source: Meta (2026d)
df = pd.read_csv(
  "https://raw.githubusercontent.com/facebook/prophet/" +
  "main/examples/example_wp_log_R.csv"
)
df["cap"] = 8.5
m = Prophet(growth="logistic")
m.fit(df)
future = m.make_future_dataframe(periods=1826)
future["cap"] = 8.5
forecast = m.predict(future)
fig = m.plot(forecast)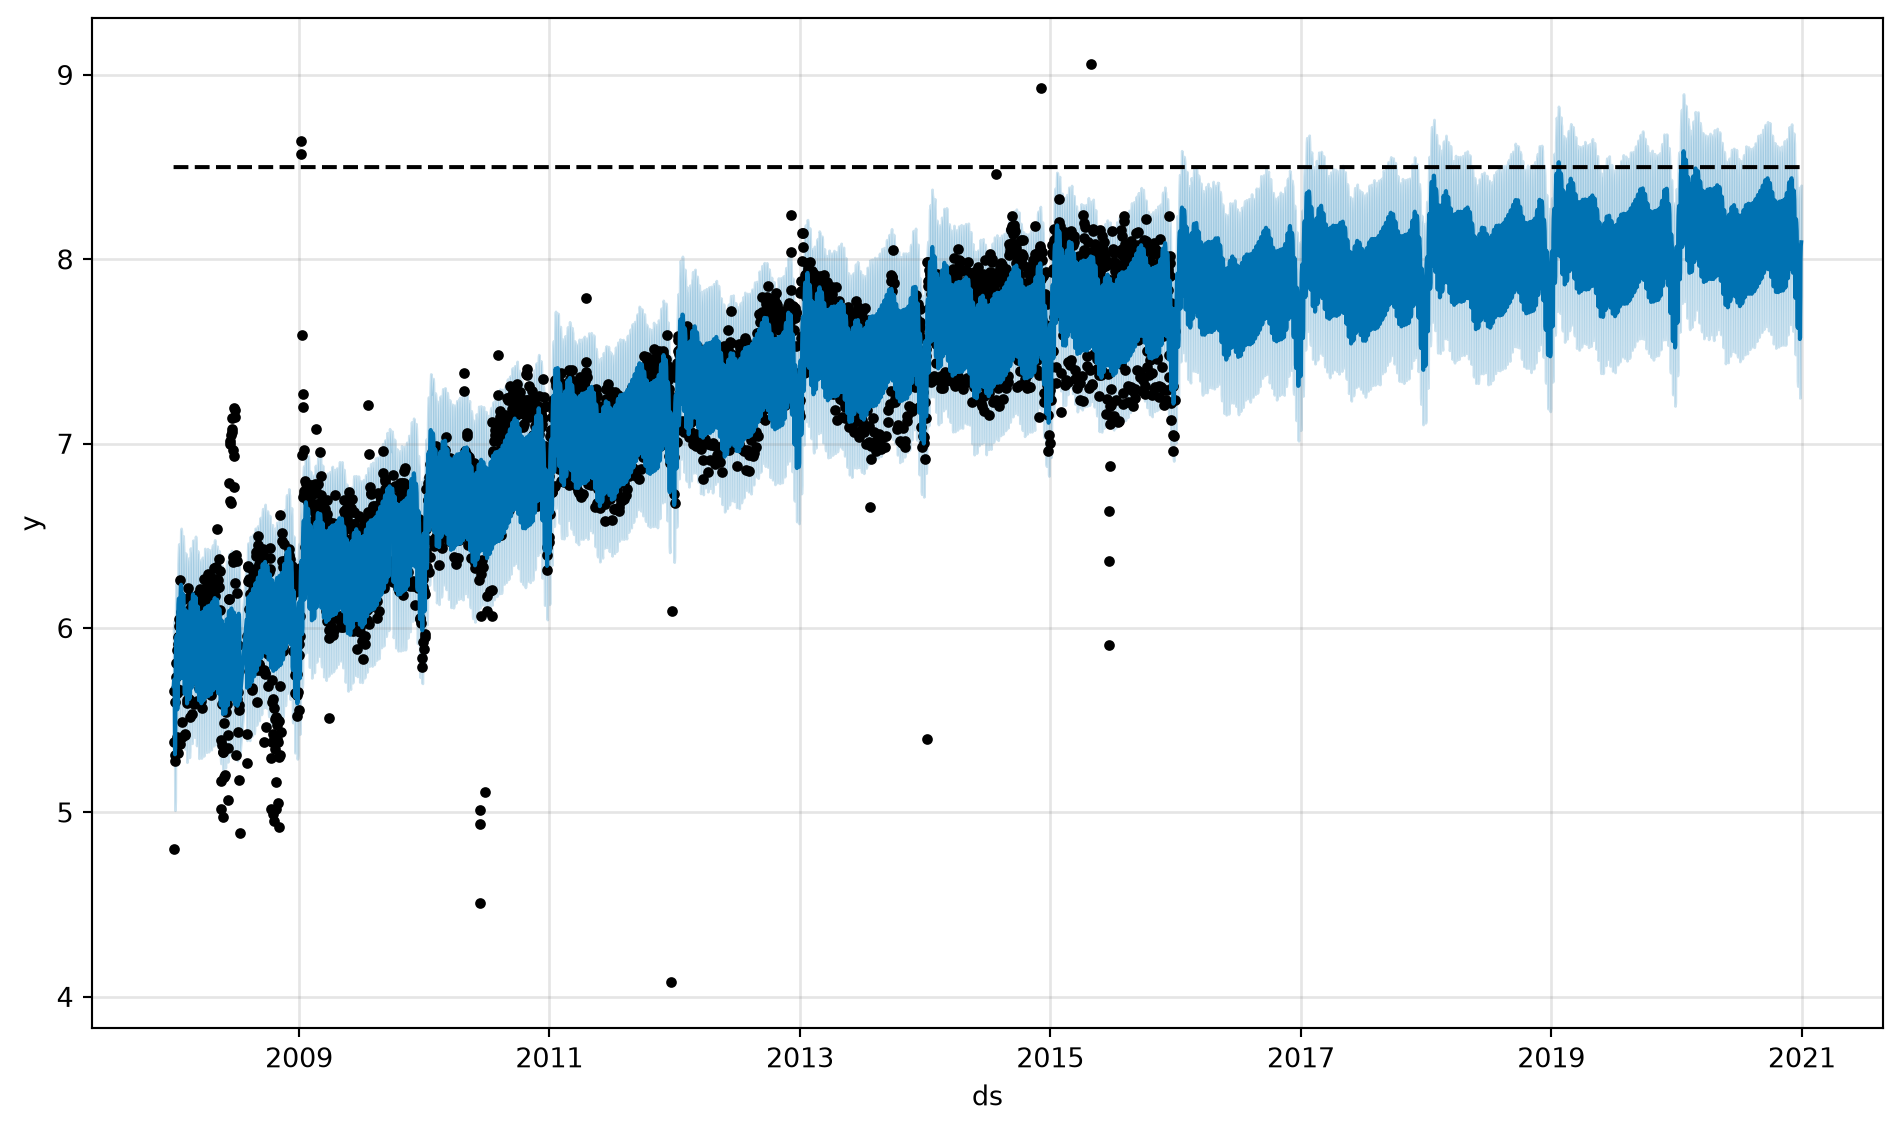
Trend changepoints
Source: Meta (2026f), Monks (2020), HSMA (2024)
Both the linear and logistic growth trend models use changepoints. These are specific points in time where the trend is allowed to shift.
A smooth trend with minimal variability implies that things will be similar in the future. It reduces uncertainty. Meanwhile, something with a lot of change points will have a wider prediction interval.
How are changepoints chosen?
Prophet detects these automatically by testing many possible points, and keeping only those where a change is observed. In more detail:
- It places a many potential changepoints across the first 80% of the data. The count is set by
n_changepoints, but it’s usually best to leave this at default and control flexibility via the regularisation parameter below instead. - It fits the model using a “sparse Laplace prior” on the size of each changepoint’s rate change. This prior assumes most changepoints have no real effect, shrinking their estimated impact toward zero unless the data strongly supports a shift.
- What remains are the changepoints with a meaningfully large rate of change.
This is a Bayesian approach: rather than deciding in advance how many changepoints are real, Prophet starts with a prior belief (most changepoints don’t matter) and updates it using the data. The Laplace prior is closely related to L1 regularisation (as in Lasso regression). Both shrink small, uncertain effects toward zero while leaving large, well-supported effects largely intact. In practice, most potential changepoints end up negligible, and only a handful with strong evidence shape the trend, preventing it from reacting to minor fluctuations.
Code source: Meta (2026c), Meta (2026f)
df = pd.read_csv(
  "https://raw.githubusercontent.com/facebook/prophet/" +
  "main/examples/example_wp_log_peyton_manning.csv"
)
m = Prophet()
m.fit(df)
future = m.make_future_dataframe(periods=365)
forecast = m.predict(future)
fig = m.plot(forecast)
a = add_changepoints_to_plot(fig.gca(), m, forecast)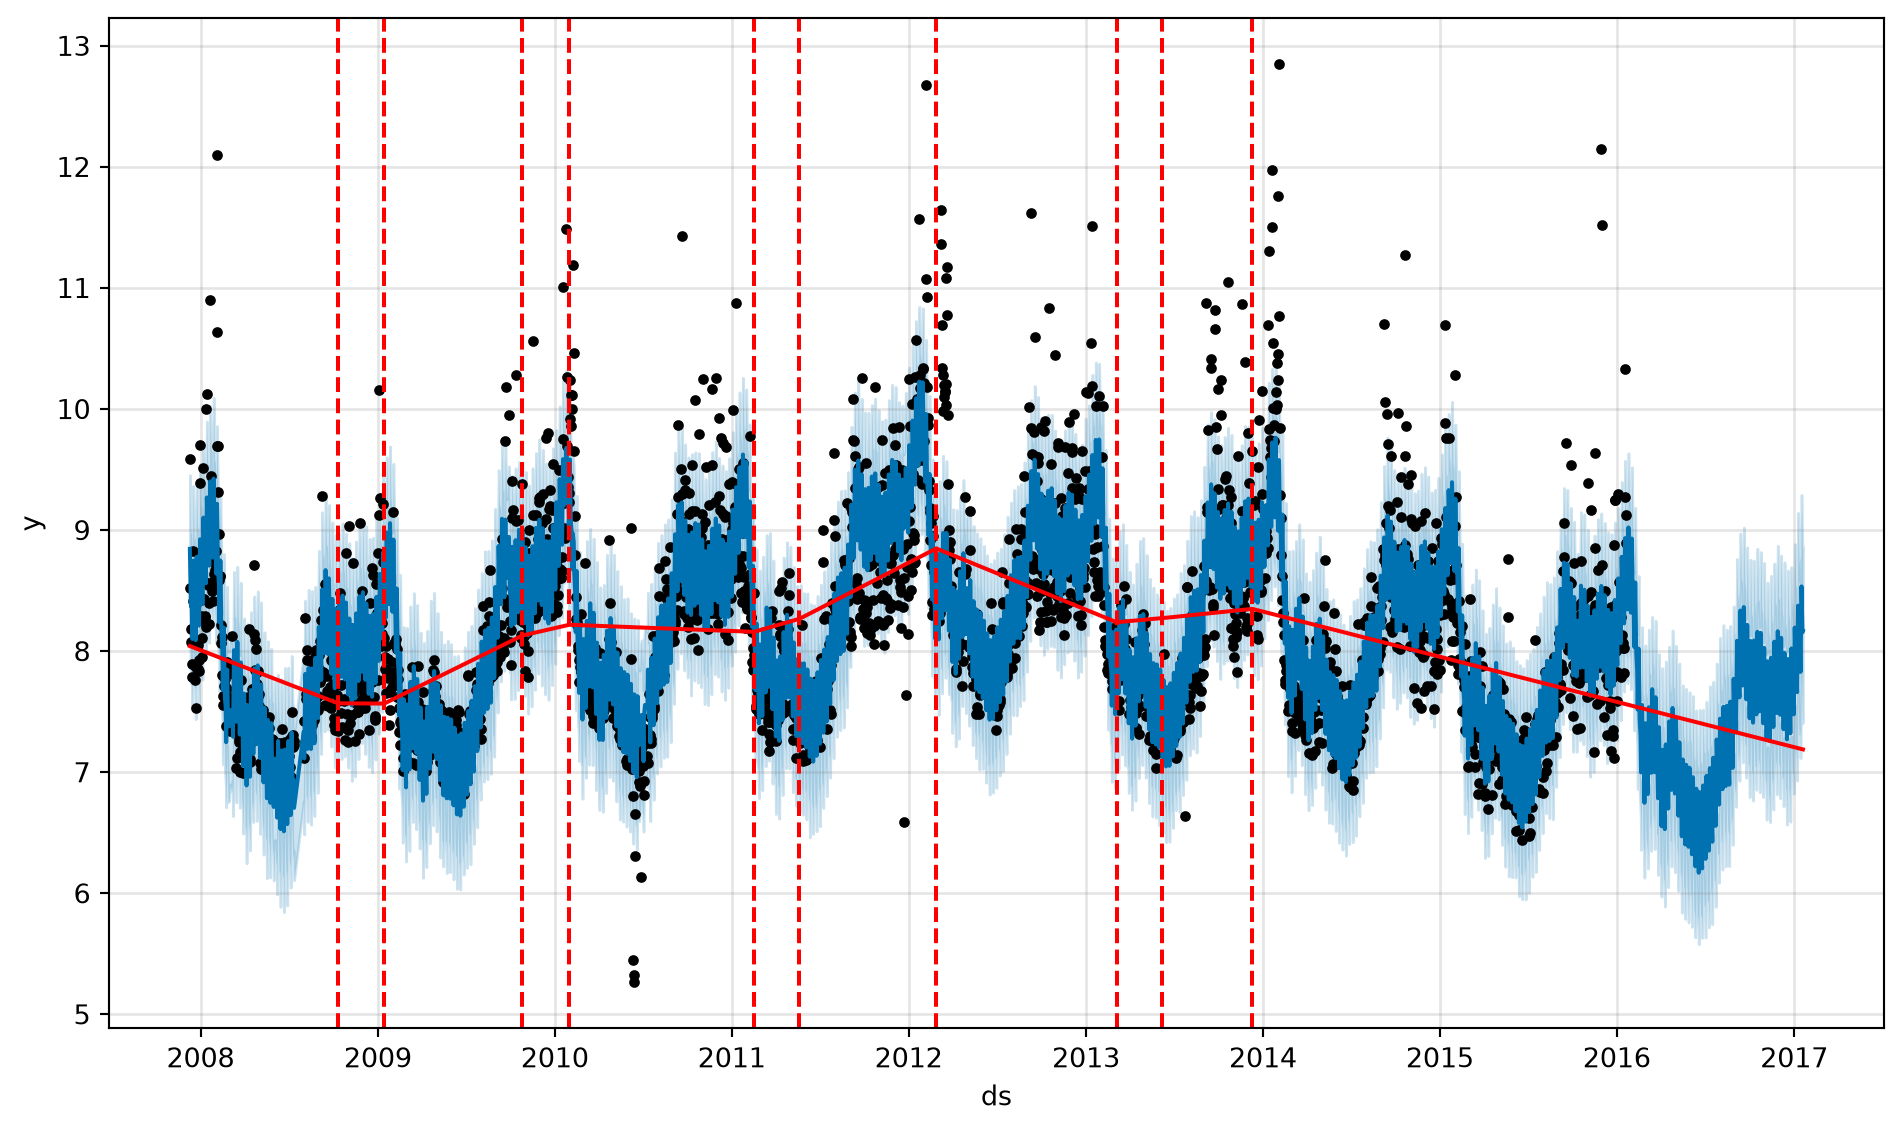
Adjusting the trend
You can adjust how flexible the trend is via changepoint_prior_scale (default 0.05):
- A higher value allows more changepoints to be accepted, giving a more flexible trend and increasing the risk of overfitting to noise.
- A lower value results in fewer changepoints and a smoother trend, but risks missing real shifts in the underlying trend.
You can also manually specify known changepoint dates if you already know when significant shifts occurred, rather than relying on automatic detection.
Fitting to only the first 80% of the data helps avoid overfitting to recent fluctuations that may not reflect a genuine long-term shift. However, in some settings, you may wish to adjust this too using changepoint_range.
Seasonality
Source: Meta (2026e)
Prophet models seasonal patterns using Fourier series. These are mathematical representations built by adding together sine and cosine waves (S-shaped curves with different starting points) of different frequencies. By adding many of these waves together at different speeds and sizes, you can approximate almost any repeating pattern.
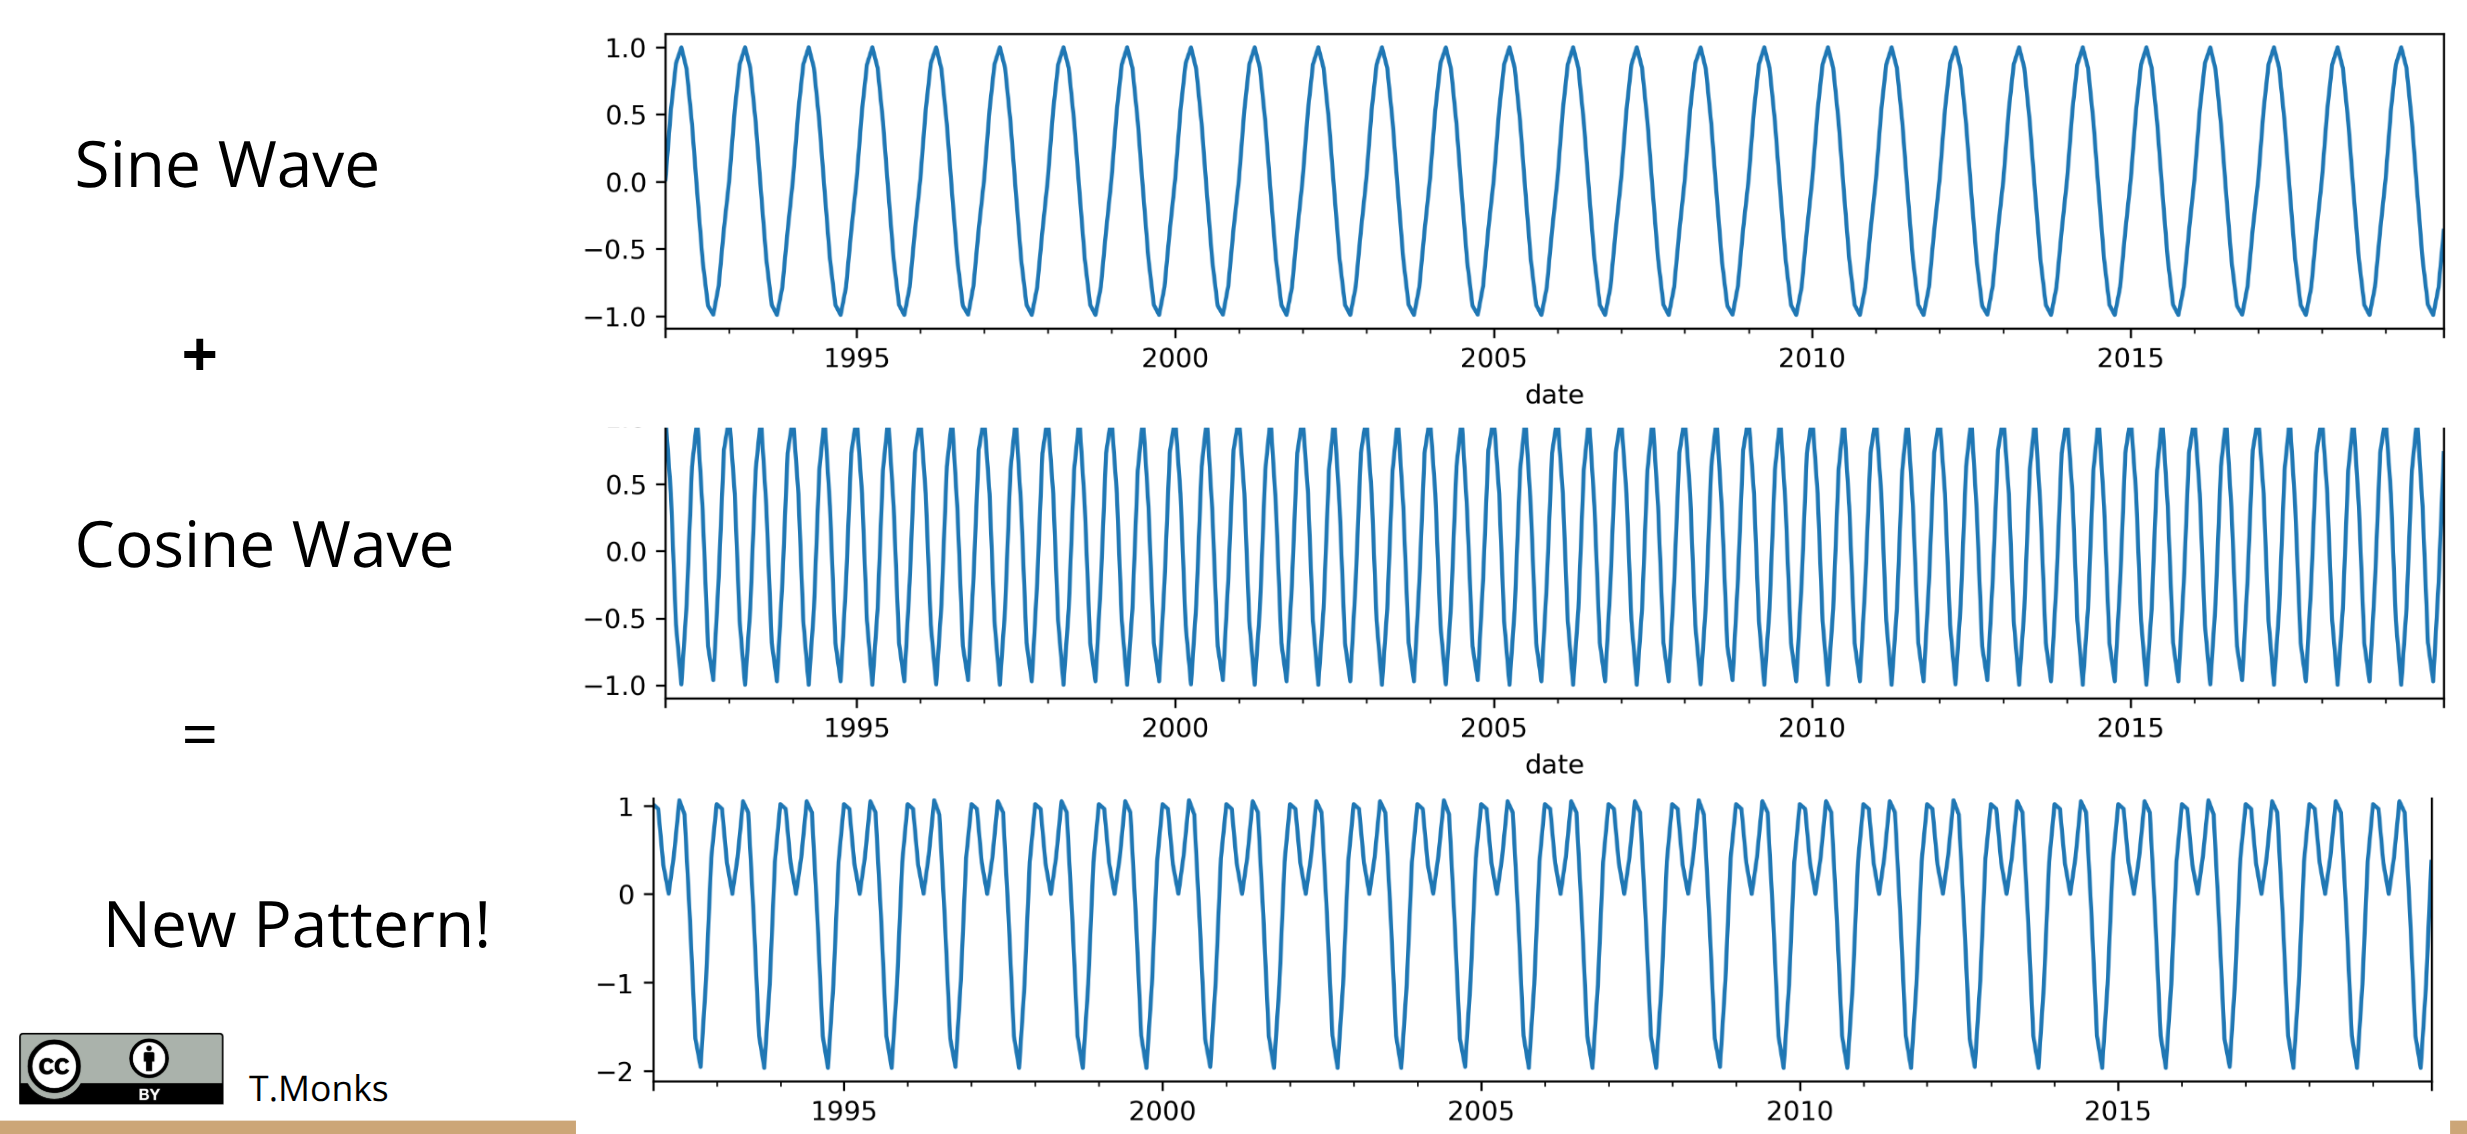
It can include seasonality at different intervals - by default:
- Yearly seasonality - repeating pattern across a calendar year (e.g., higher demand in summer, lower in winter).
- Weekly seasonality - repeating pattern within a single week (e.g., peaks on Monday and Friday).
- Daily seasonality - repeating pattern within a single day (e.g., peaks at 8am and 6pm).
You can also use add_seasonality to add other periods like monthly, quarterly and hourly seasonality.
Prophet checks whether you have enough data before including each default seasonality. For example, yearly and weekly seasonality required at least two cycles (i.e., 2 years and/or 2 weeks). Daily seasonality is only included if your timestamps are sub-daily.
Example of forecast with weekly and yearly seasonality
Source: Meta (2026e)
df = pd.read_csv(
  "https://raw.githubusercontent.com/facebook/prophet/" +
  "main/examples/example_wp_log_peyton_manning.csv"
)
m = Prophet().fit(df)
future = m.make_future_dataframe(periods=365)
forecast = m.predict(future)
fig = m.plot_components(forecast)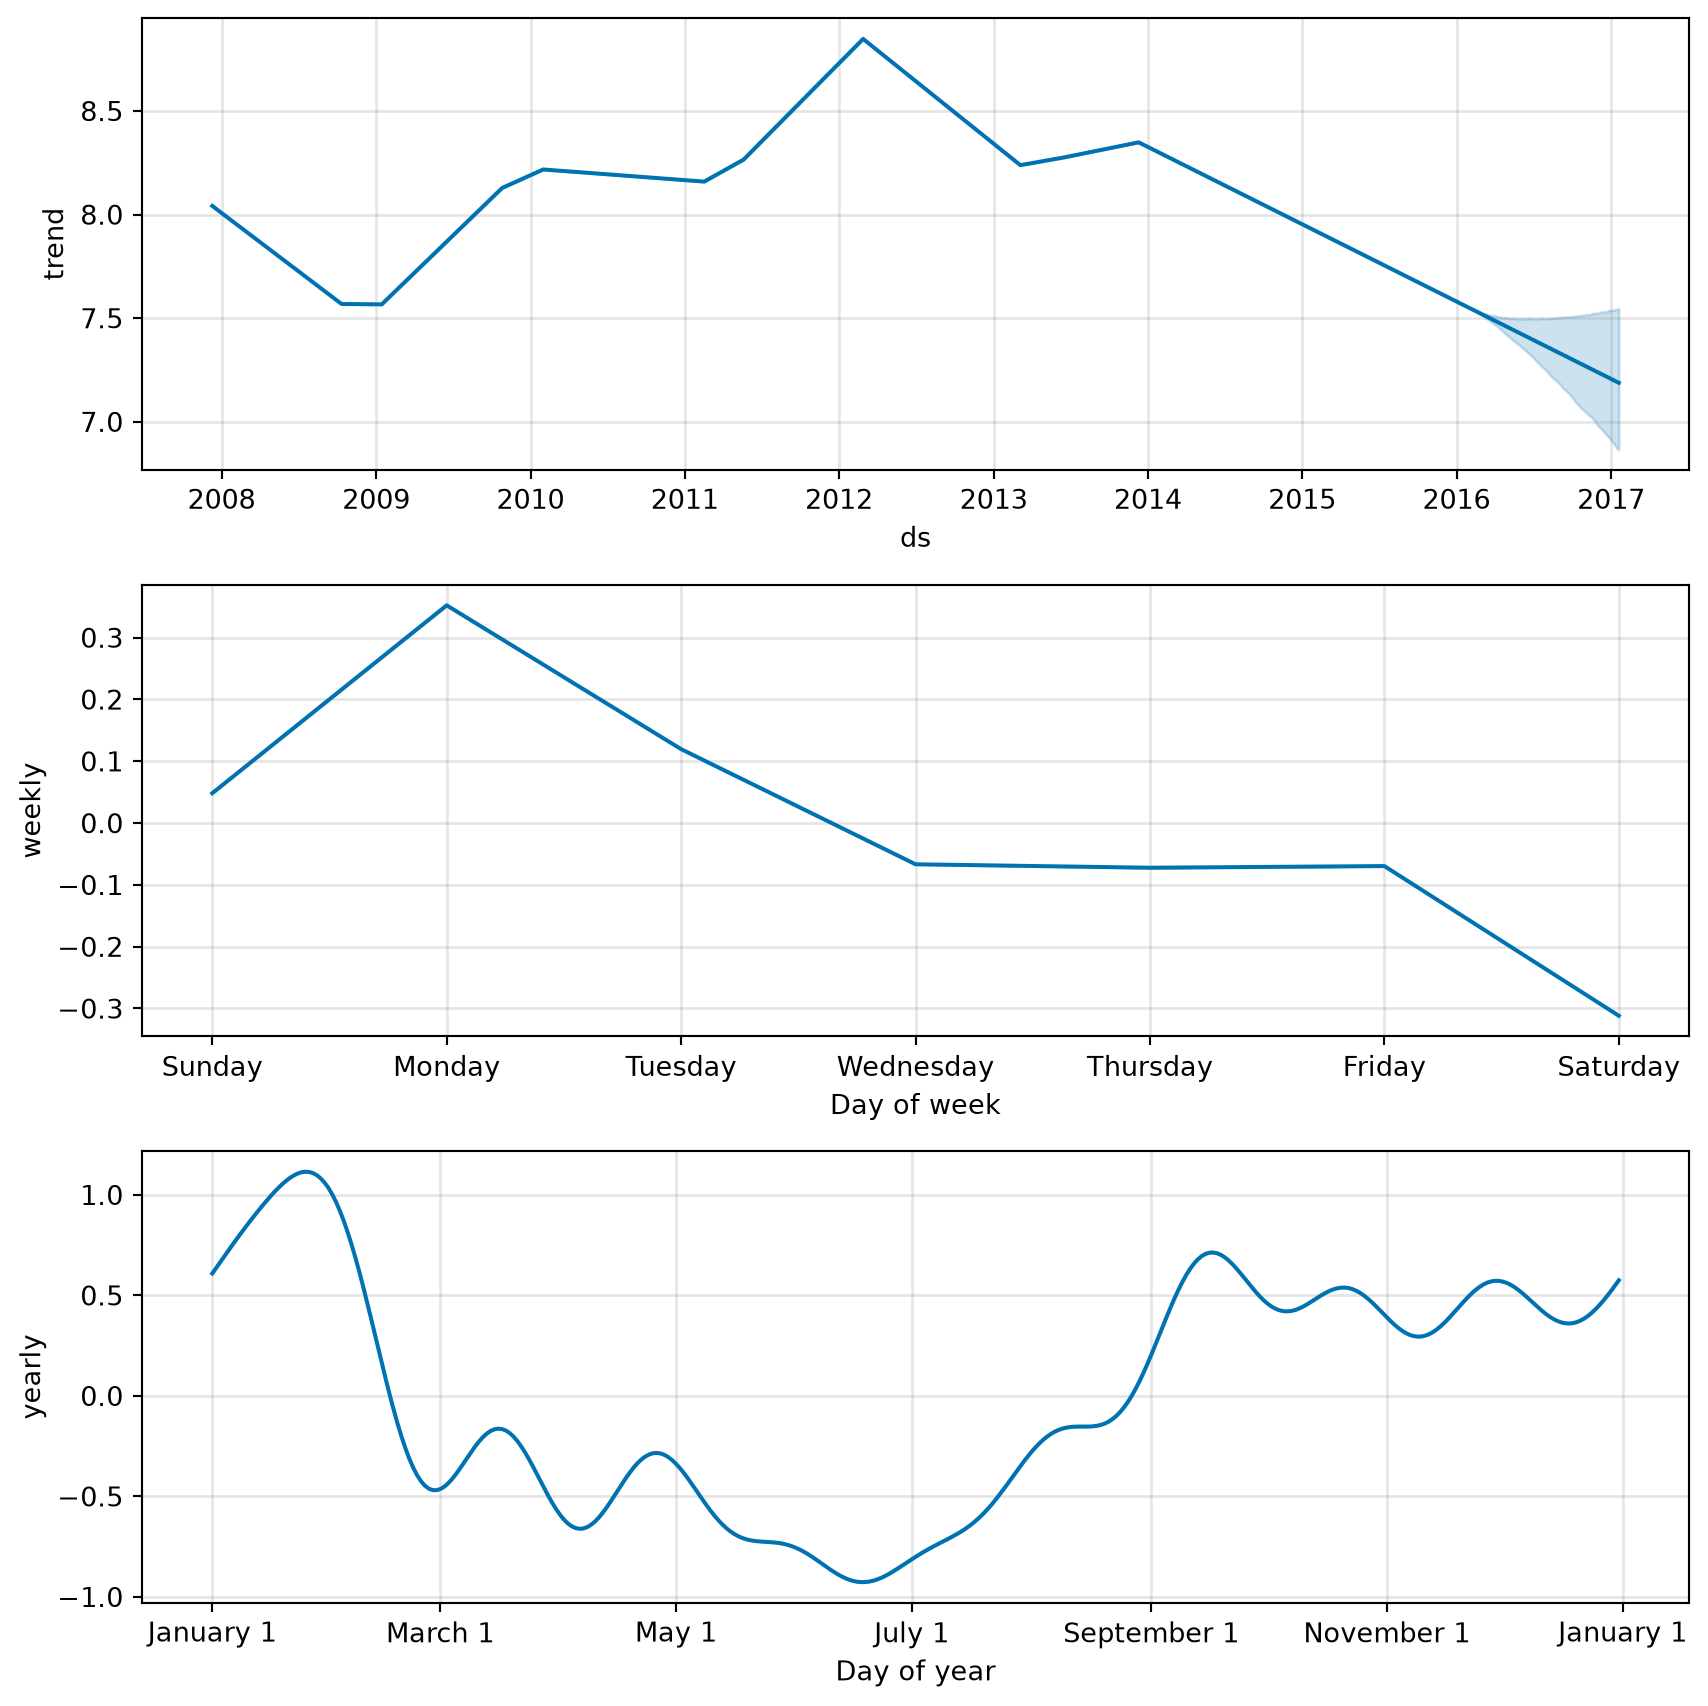
Conditional seasonality
Source: Meta (2026e)
Seasonality may depend on other factors - for example, if the pattern of weekly seasonnality is different in the summer versus the winter. This can be modelled using conditional seasonalities.
- Add a boolean column to your dataframe marking which season each date falls into.
- Disable the default weekly seasonality.
- Add custom seasonality terms for each season using
add_seasonality(), only applying it to relevant dates marked by the boolean column.
Multiplicative seasonality
Source: Meta (2026a)
By default, Prophet fits additive seasonality. This means the seasonal effect is added to the trend to get the forecast, so the size of the seasonal effect is constant.
If seasonality is not a constant additive factor, but instead growts with trend, this is multiplicative seasonality.
In the example below, there is a clear yearly cycle, but with additive seasonality, the model forecast (blue) fits poorly against the actual values (black). The seasonal effect is too large near the start of the series and too small by the end.
df = pd.read_csv(
  "https://raw.githubusercontent.com/facebook/prophet/" +
  "main/examples/example_air_passengers.csv"
)
m = Prophet()
m.fit(df)
future = m.make_future_dataframe(50, freq="MS")
forecast = m.predict(future)
fig = m.plot(forecast)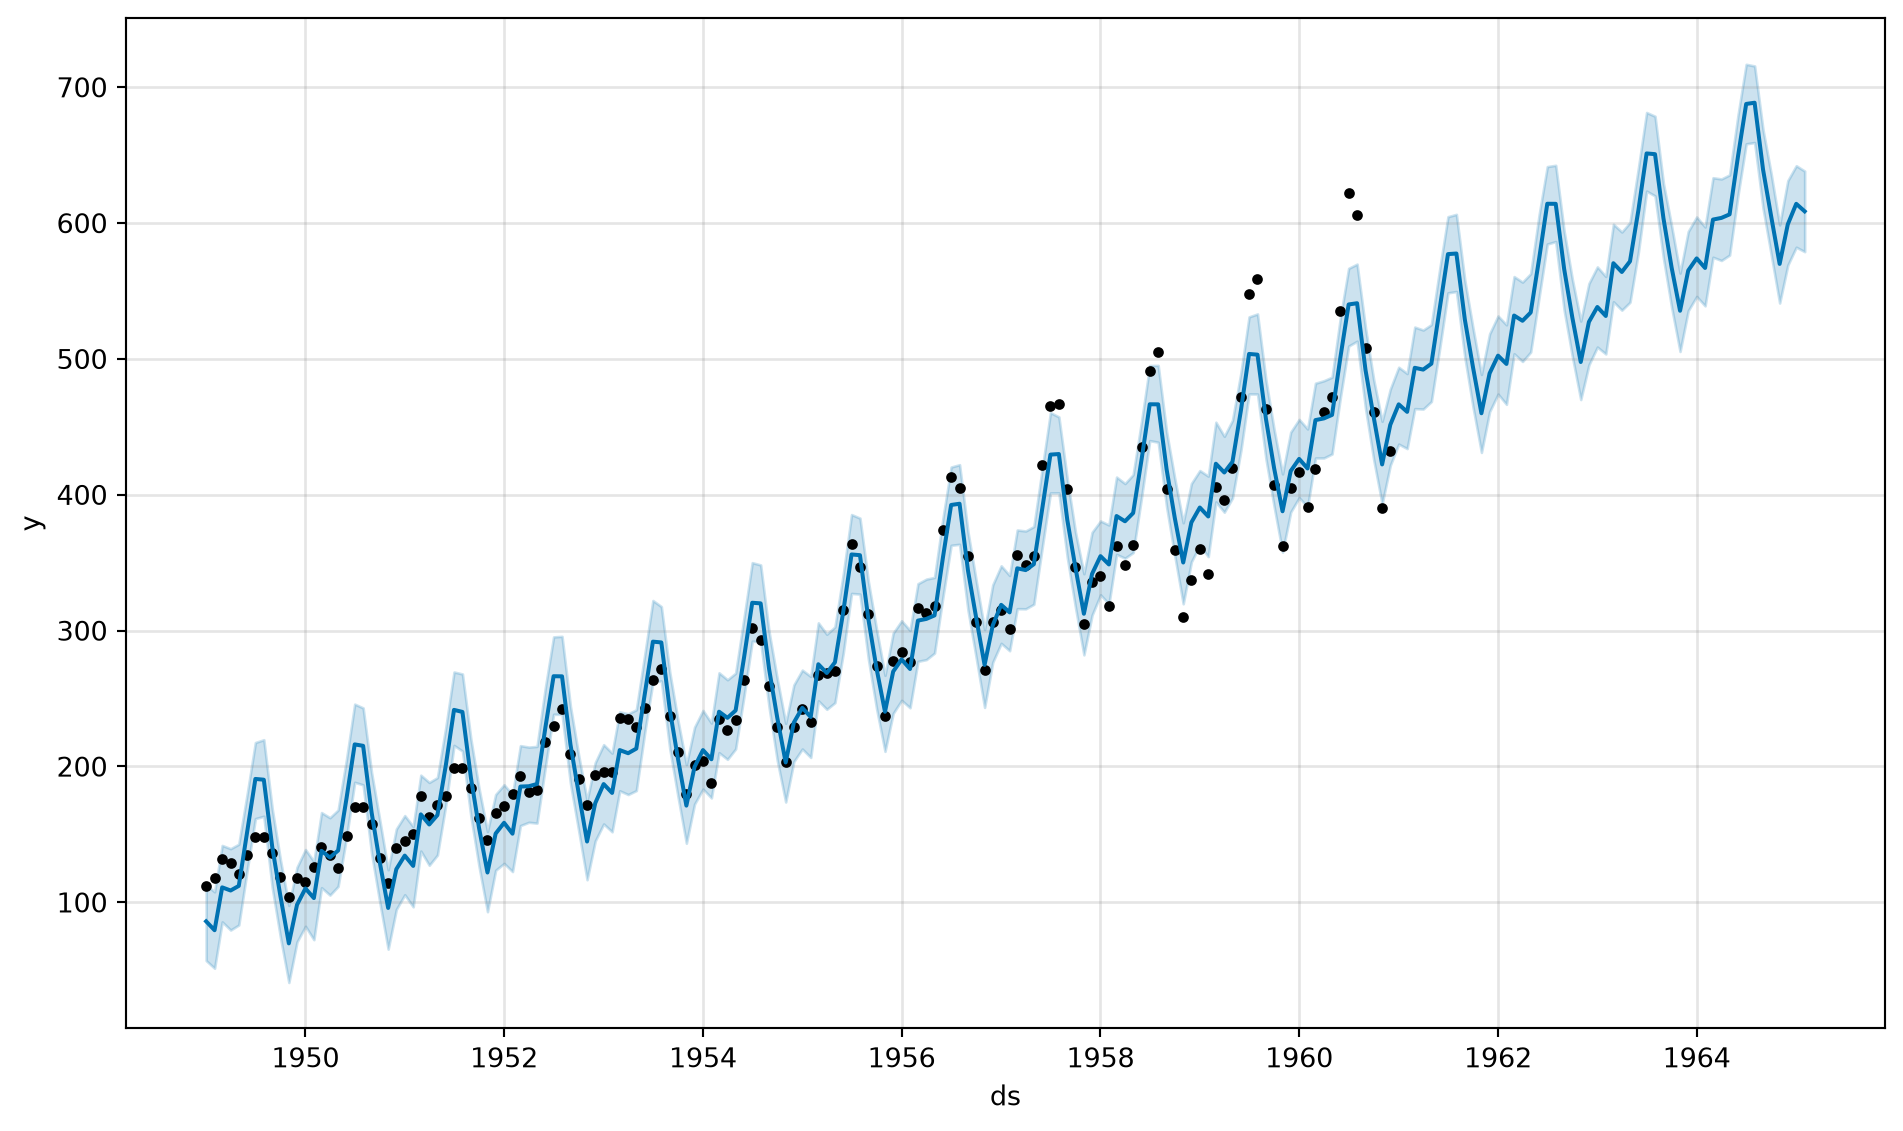
This can be corrected by setting seasonality_mode="multiplicative", which multiplies the trend by the seasonal component instead of adding it.
m = Prophet(seasonality_mode="multiplicative")
m.fit(df)
future = m.make_future_dataframe(50, freq="MS")
forecast = m.predict(future)
fig = m.plot(forecast)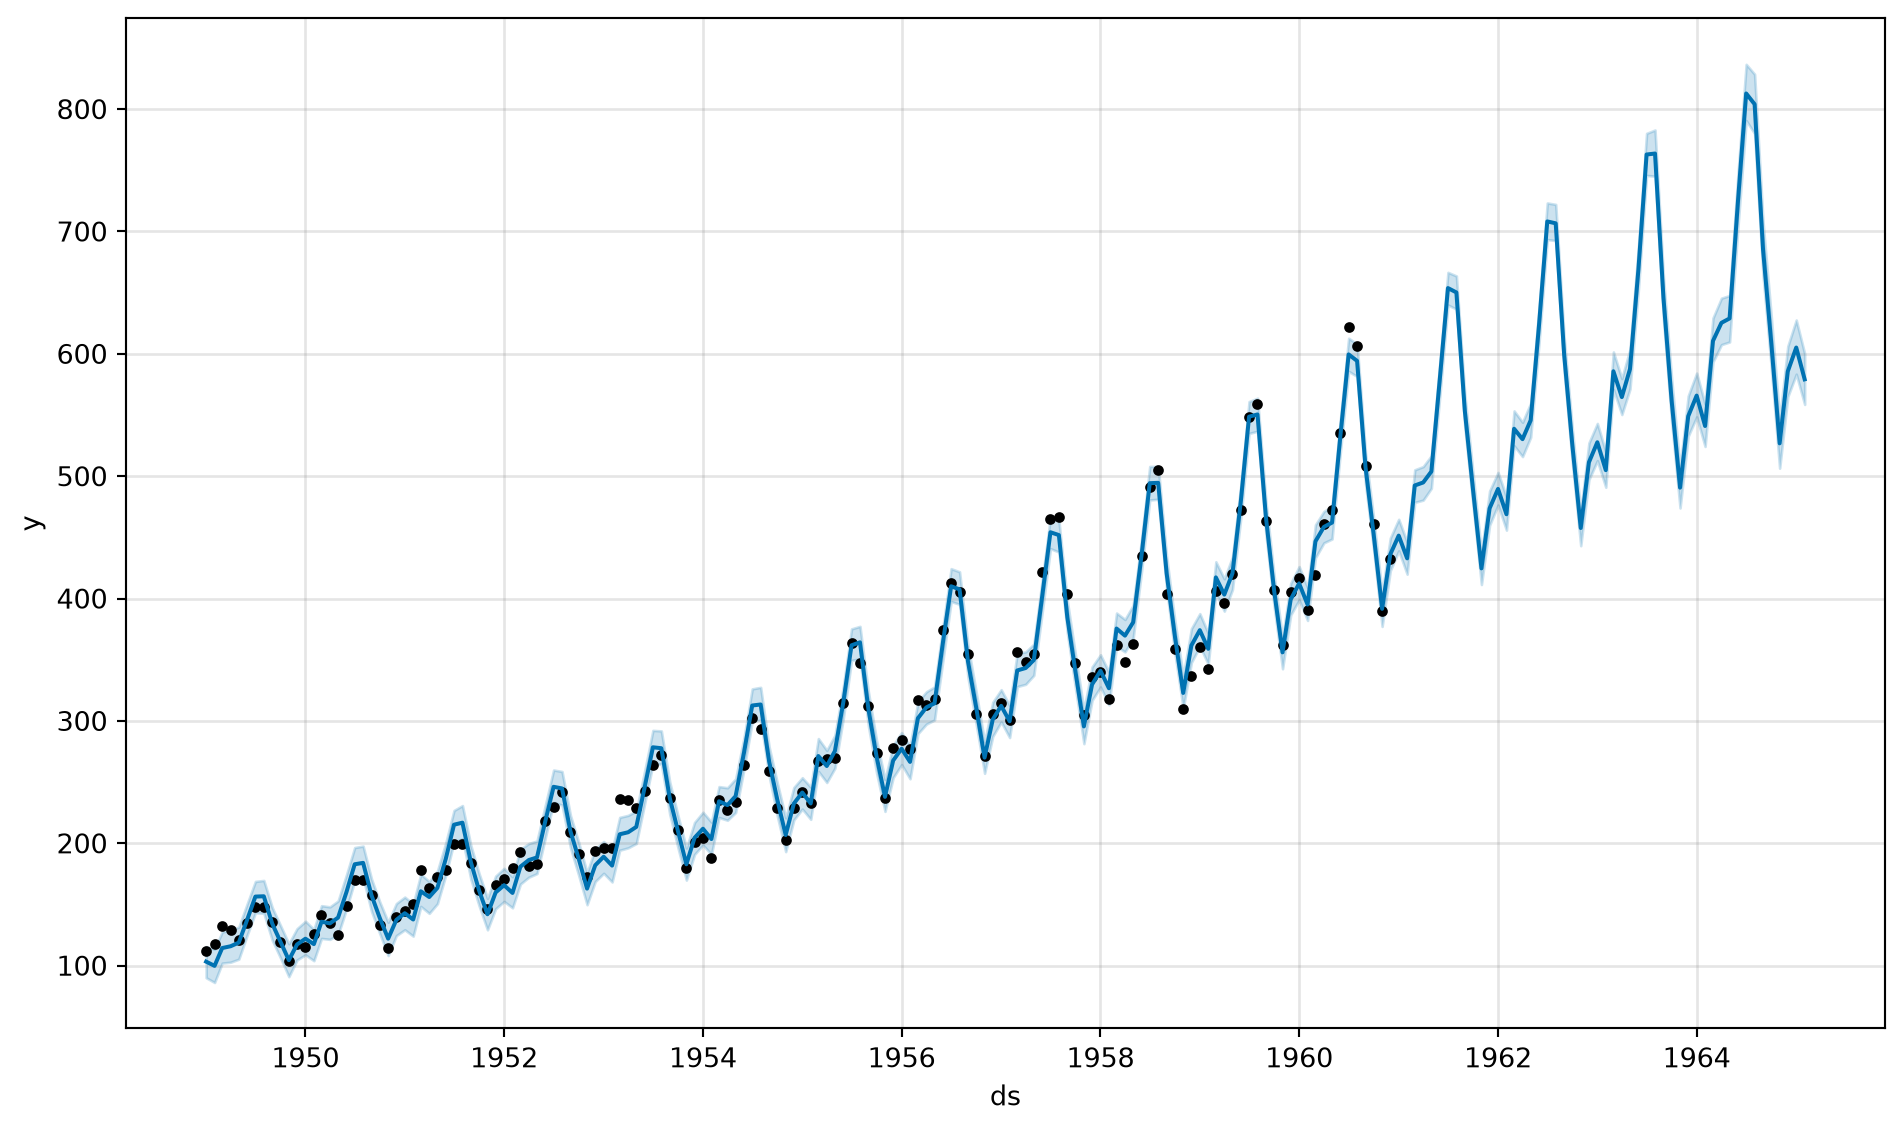
Holidays
Source: Meta (2026e)
Prophet has built-in support for public holidays and can accept any custom event dates. Each holiday is modelled as a dummy variable (1 on the holiday date, 0 otherwise), with an associated coefficient estimating its effect on the trend. You can use lower_window and upper_window parameters to extend the holiday effect to the days around the date.
Error
The error term captures whatever variation in the data is left over once the trend, seasonality, and holiday components have all been accounted for. It is essentially the noise the model can’t explain.
Prophet assumes errors are independent and identically distributed (i.i.d.): the leftover noise should look the same at every point in time, with no pattern linking one error to the next. If residuals grow over time or cluster around certain dates, that violates i.i.d. and signals unaccounted structure rather than pure noise.
Additional regressors
Source: Meta (2026e)
External variables can be included as additional regressors - for example, weather data, or the performance of a related service.
You will need to have future values of that variable available for the forecasting period too, which usually means forecasting it first.
Prediction intervals
Source: (prophet_monks?)
Prophet prediction intervals are nearly always “too” narrow. Potential (complex) solutions:
- Combination/Ensemble forecasts - average of Prophet and another method (e.g., ARIMA).
- Use ARIMA to forecast Prophet residuals (errors) then adjust the Prophet forecast accordingly.
- Bagging (bootstrap aggregating) - create bootstrap time series, fit and predict from multiple models to capture uncertainty.
References
EPFL. 2021. Statistical Analysis of Sparse and Piecewise-Linear Regression. https://www.epfl.ch/labs/lcav/statistical-analysis-of-sparse-and-piecewise-linear-regression/.
HSMA. 2024. 8B Forecasting: Part 2 - Forecsting with Prophet. https://github.com/hsma-programme/8b_forecasting/blob/main/HSMA%205%20Slides%20-%20Part%202%20-%20Forecasting%20with%20Prophet.pdf.
Meta. 2026a. Multiplicative Seasonality. https://facebook.github.io/prophet/docs/multiplicative_seasonality.html.
Meta. 2026b. Prophet: Forecasting at Scale. https://facebook.github.io/prophet/.
Meta. 2026c. Quick Start. https://facebook.github.io/prophet/docs/quick_start.html.
Meta. 2026d. Saturating Forecasts. https://facebook.github.io/prophet/docs/saturating_forecasts.html.
Meta. 2026e. Seasonality, Holiday Effects, and Regressors. https://facebook.github.io/prophet/docs//seasonality,_holiday_effects,_and_regressors.html.
Meta. 2026f. Trend Changepoints. https://facebook.github.io/prophet/docs/trend_changepoints.html.
Monks, Tom. 2020. Facebook’s Prophet. https://docs.google.com/presentation/d/1MqzgirZyMctmGKaudnoufHZvp06bGS8qbIKI2g-zEz0.