Conceptual modelling
The proposed approach begins with a simple prototype and builds up in stages. Each stage aligns with specific use case proposed by the ambulance service. Within each stage, we define:
- The key question(s) being asked.
- Model content and inputs, including optional layers of complexity.
- Outputs.
Progressing through the stages, we can evaluate whether the added detail improves the model’s validity for previous questions, or whether the simpler version remains sufficient.
Stage 1: Whole-system resourcing
Key question
How do changes in total vehicle hours affect Category 2 mean response time and resource utilisation?
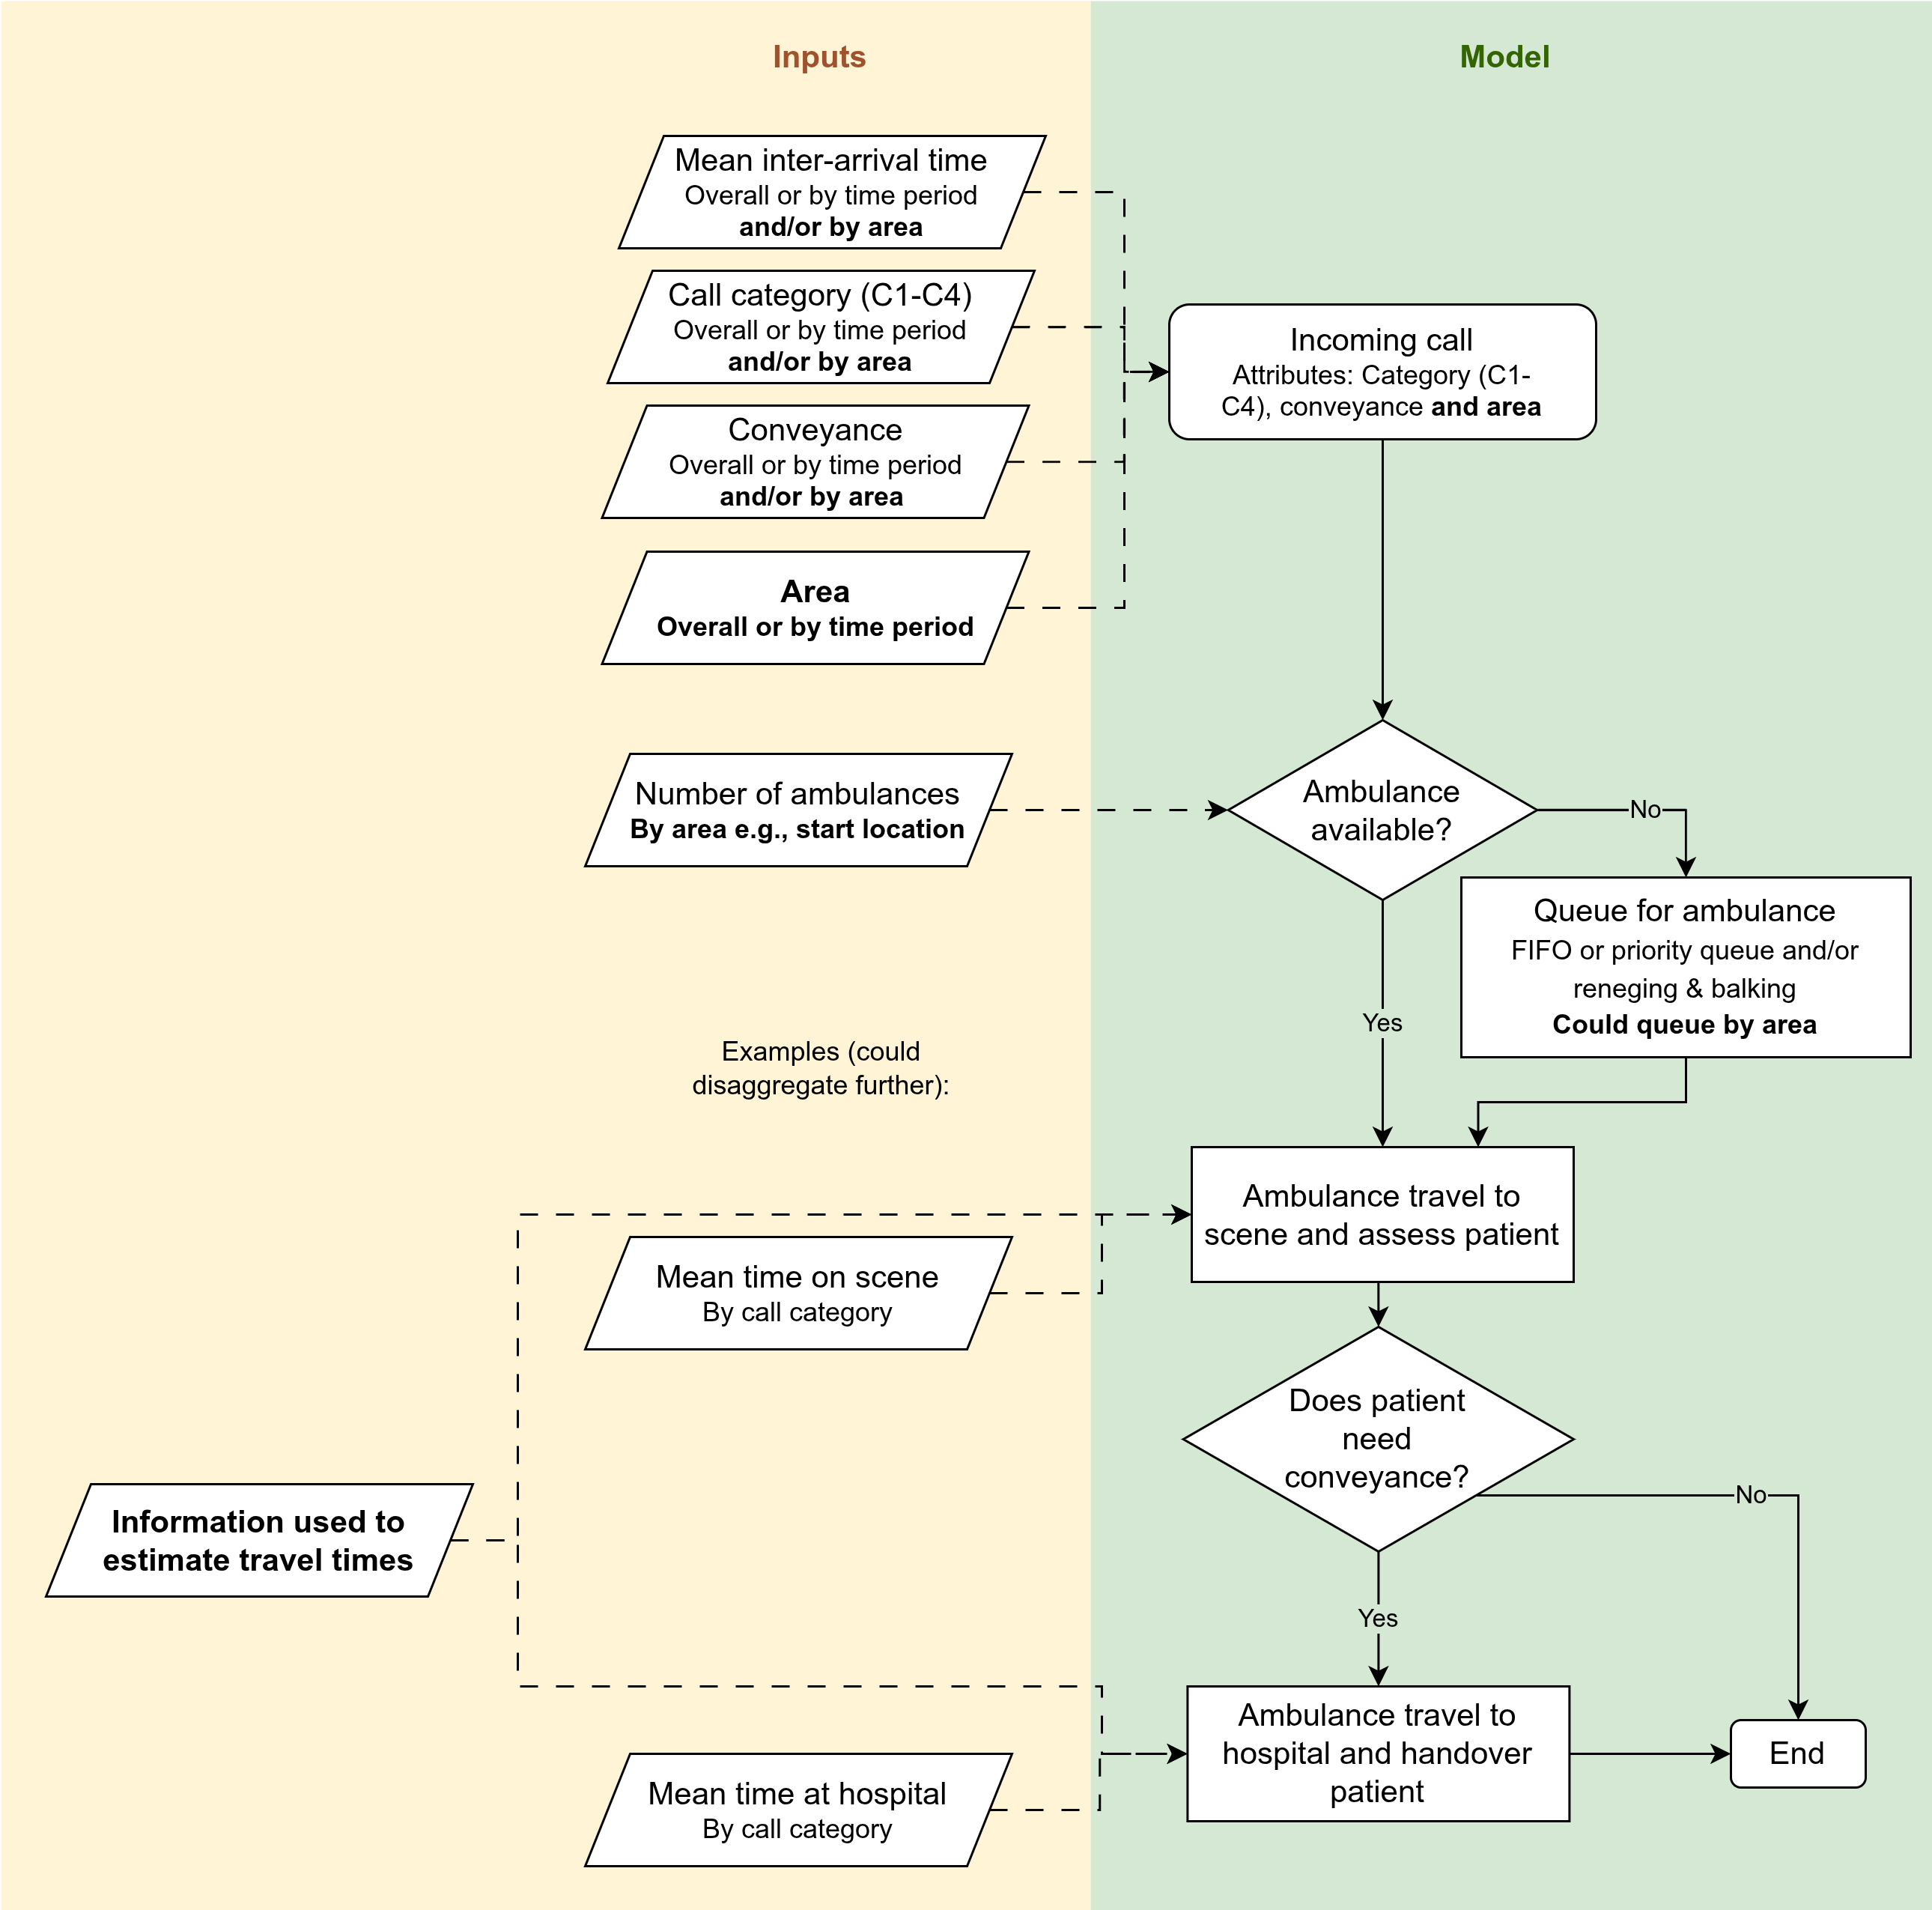
Model content and inputs
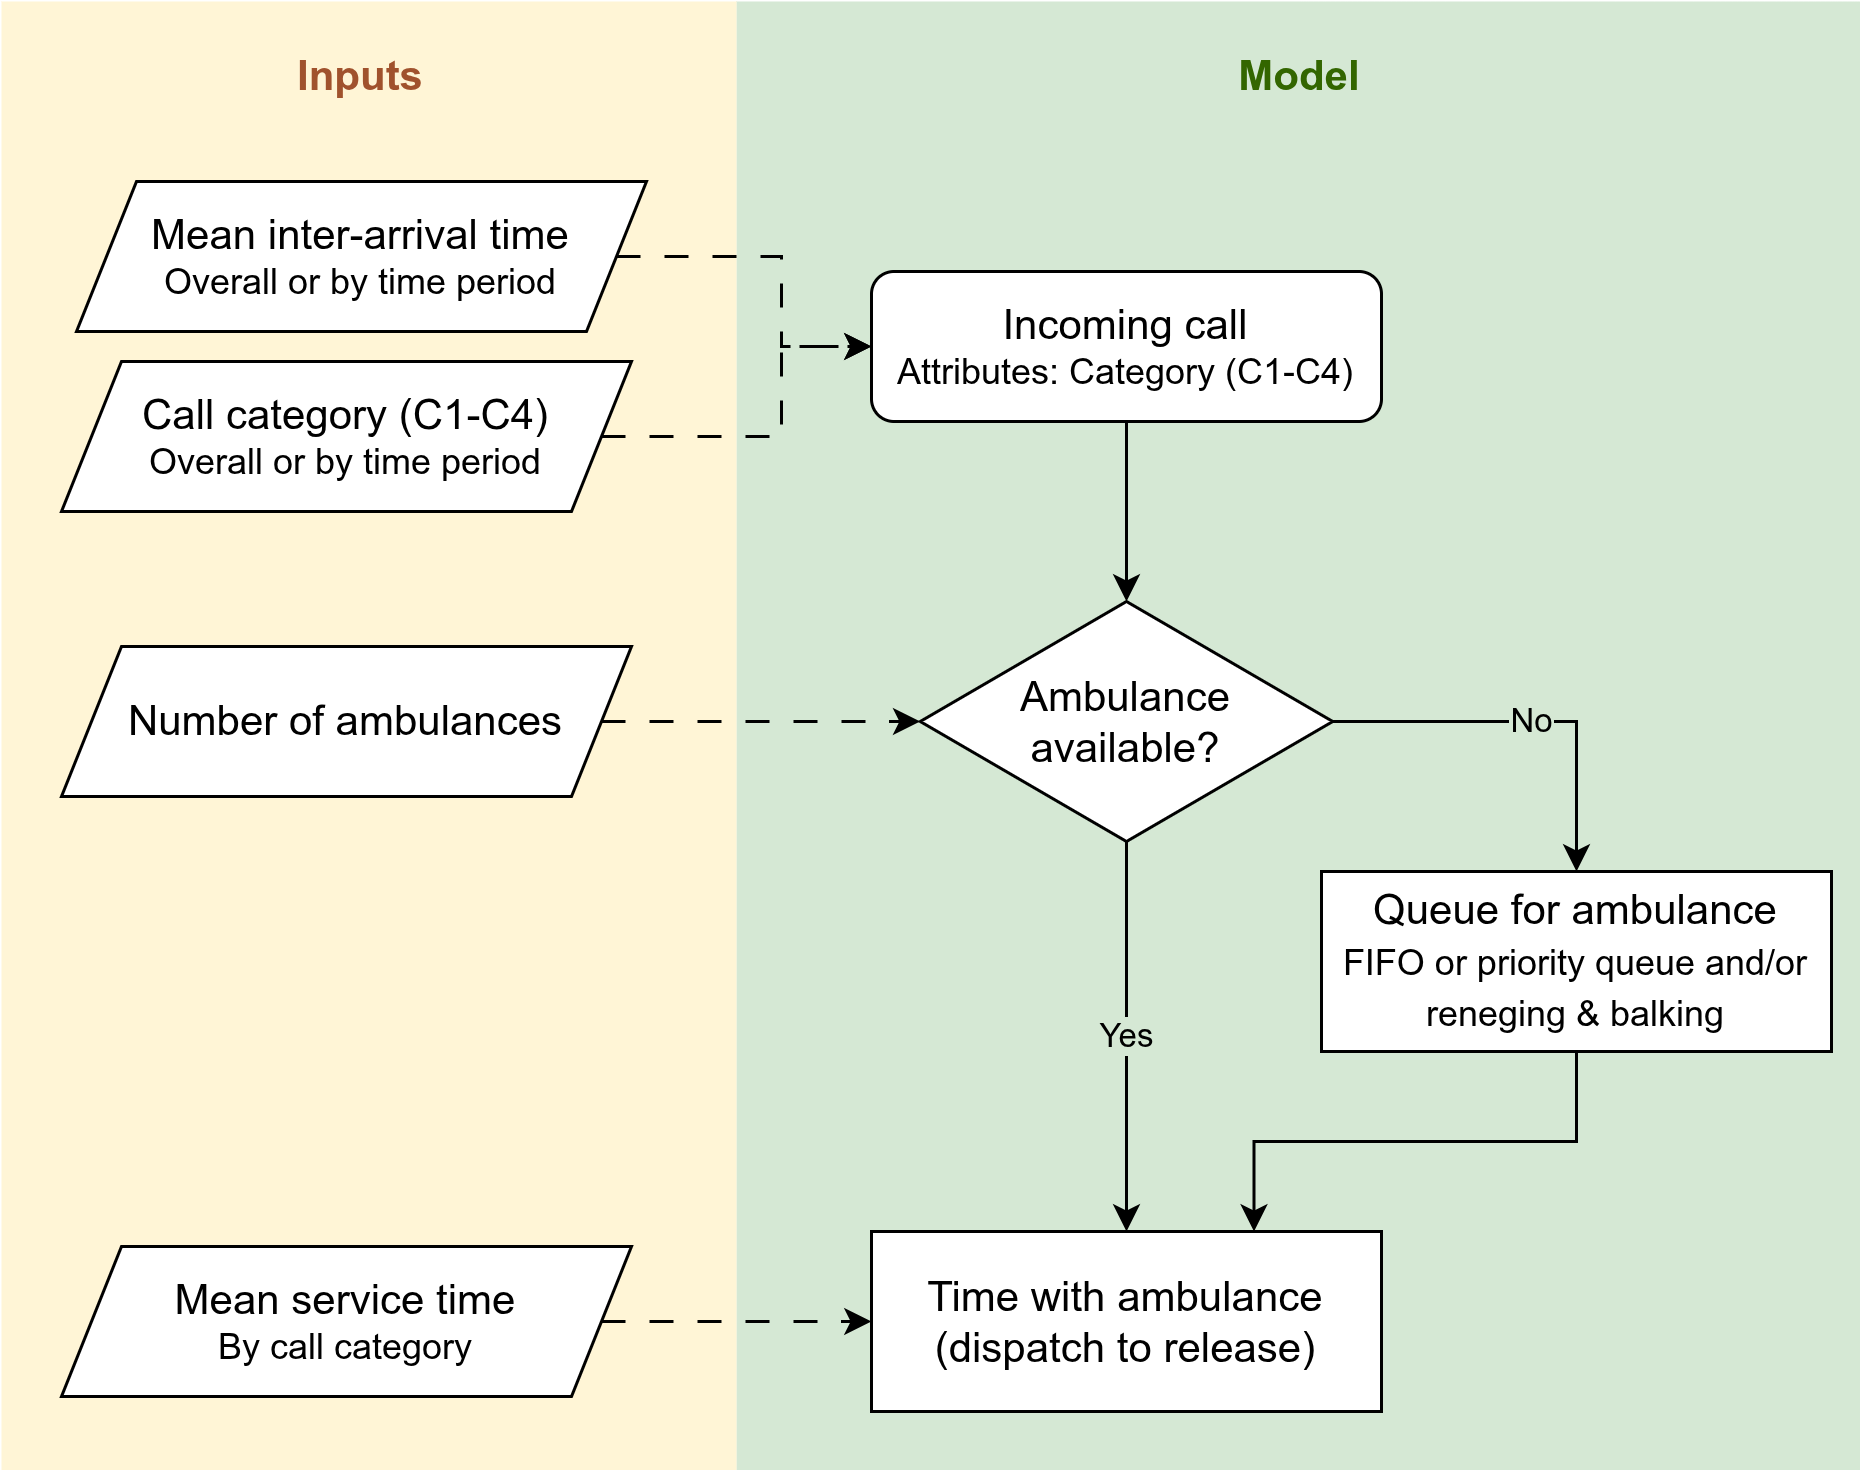
| Element | Model content | Input |
|---|---|---|
| Arrivals | Basic arrival process or NHPP based on observed patterns | By call category, mean inter-arrival time for whole system OR mean by period of time |
| Call category | Separate arrival times - part of arrival distribution or assigned after | If NHPP is used and we want to do call category by time period, it should be sampled as part of NHPP too. If don’t want call category probabilities to be by time period, then can just assign them using another probability distribution afterwards |
| Resource | Single pooled ambulance resource | Number of ambulances for whole system |
| Queue | First come first serve or prioritisation rules with potential reneging/balking | Priority rules could likely be informed by call guidelines |
| Service time | Single time (disatpch to resource available) | Mean time, by call category |
For initilalisation bias, use warm-up (as initial conditions can be complicated to find). Determine appropriate length of warm-up programmatically.
For uncertainty, use replications (as more intuitive than long run). Determine number of replications programmatically.
For distributions used, will do input modelling.
Outputs:
- Primary: Category 2 mean response time
- Secondary: Resource utilisation
Give results per run And overall across reps Can quantify uncertainty via 95% confidence interval (or could do prediction interval)
Notes
This stage can serve as a benchmark against the current regression models. The DES version should broadly agree with regression estimates, while offering richer outputs. Regression is simpler, faster and easier to validate. However benefits of DES are:
- Multiple outcomes from the same run (regression just one per model).
- More intuitive system representation (can “see” how resourcing assumptions translate into waits and utilisation).
- Extendability (once core structure is in place, we can add more components in later stages).
To discuss:
- To answer this question, do we need to report by whether conveyed or not? In which case, need to incorporate here (rather than stage 3).
- Relatedly, when consider conveyance, is it about:
- Conveyed v.s. Non-conveyed (hear-and-treat and see-and-treat), or
- Conveyed v.s. Hear-and-treat v.s., See-and-treat
- Does ambulance service have any existing analysis looking at trends in call arrivals? Want to understand what the hour / day of week variation is. Likewise, for call categories by time period.
Stage 2: Resourcing by county (without interaction)
Key question
If total vehicle hours change in a specific county, how do Category 2 response times and utilisation change within that county?
Done on county level as that lines up with organisational structure Although is coming up more in conversations about the hospital level as thats where they go
Model changes
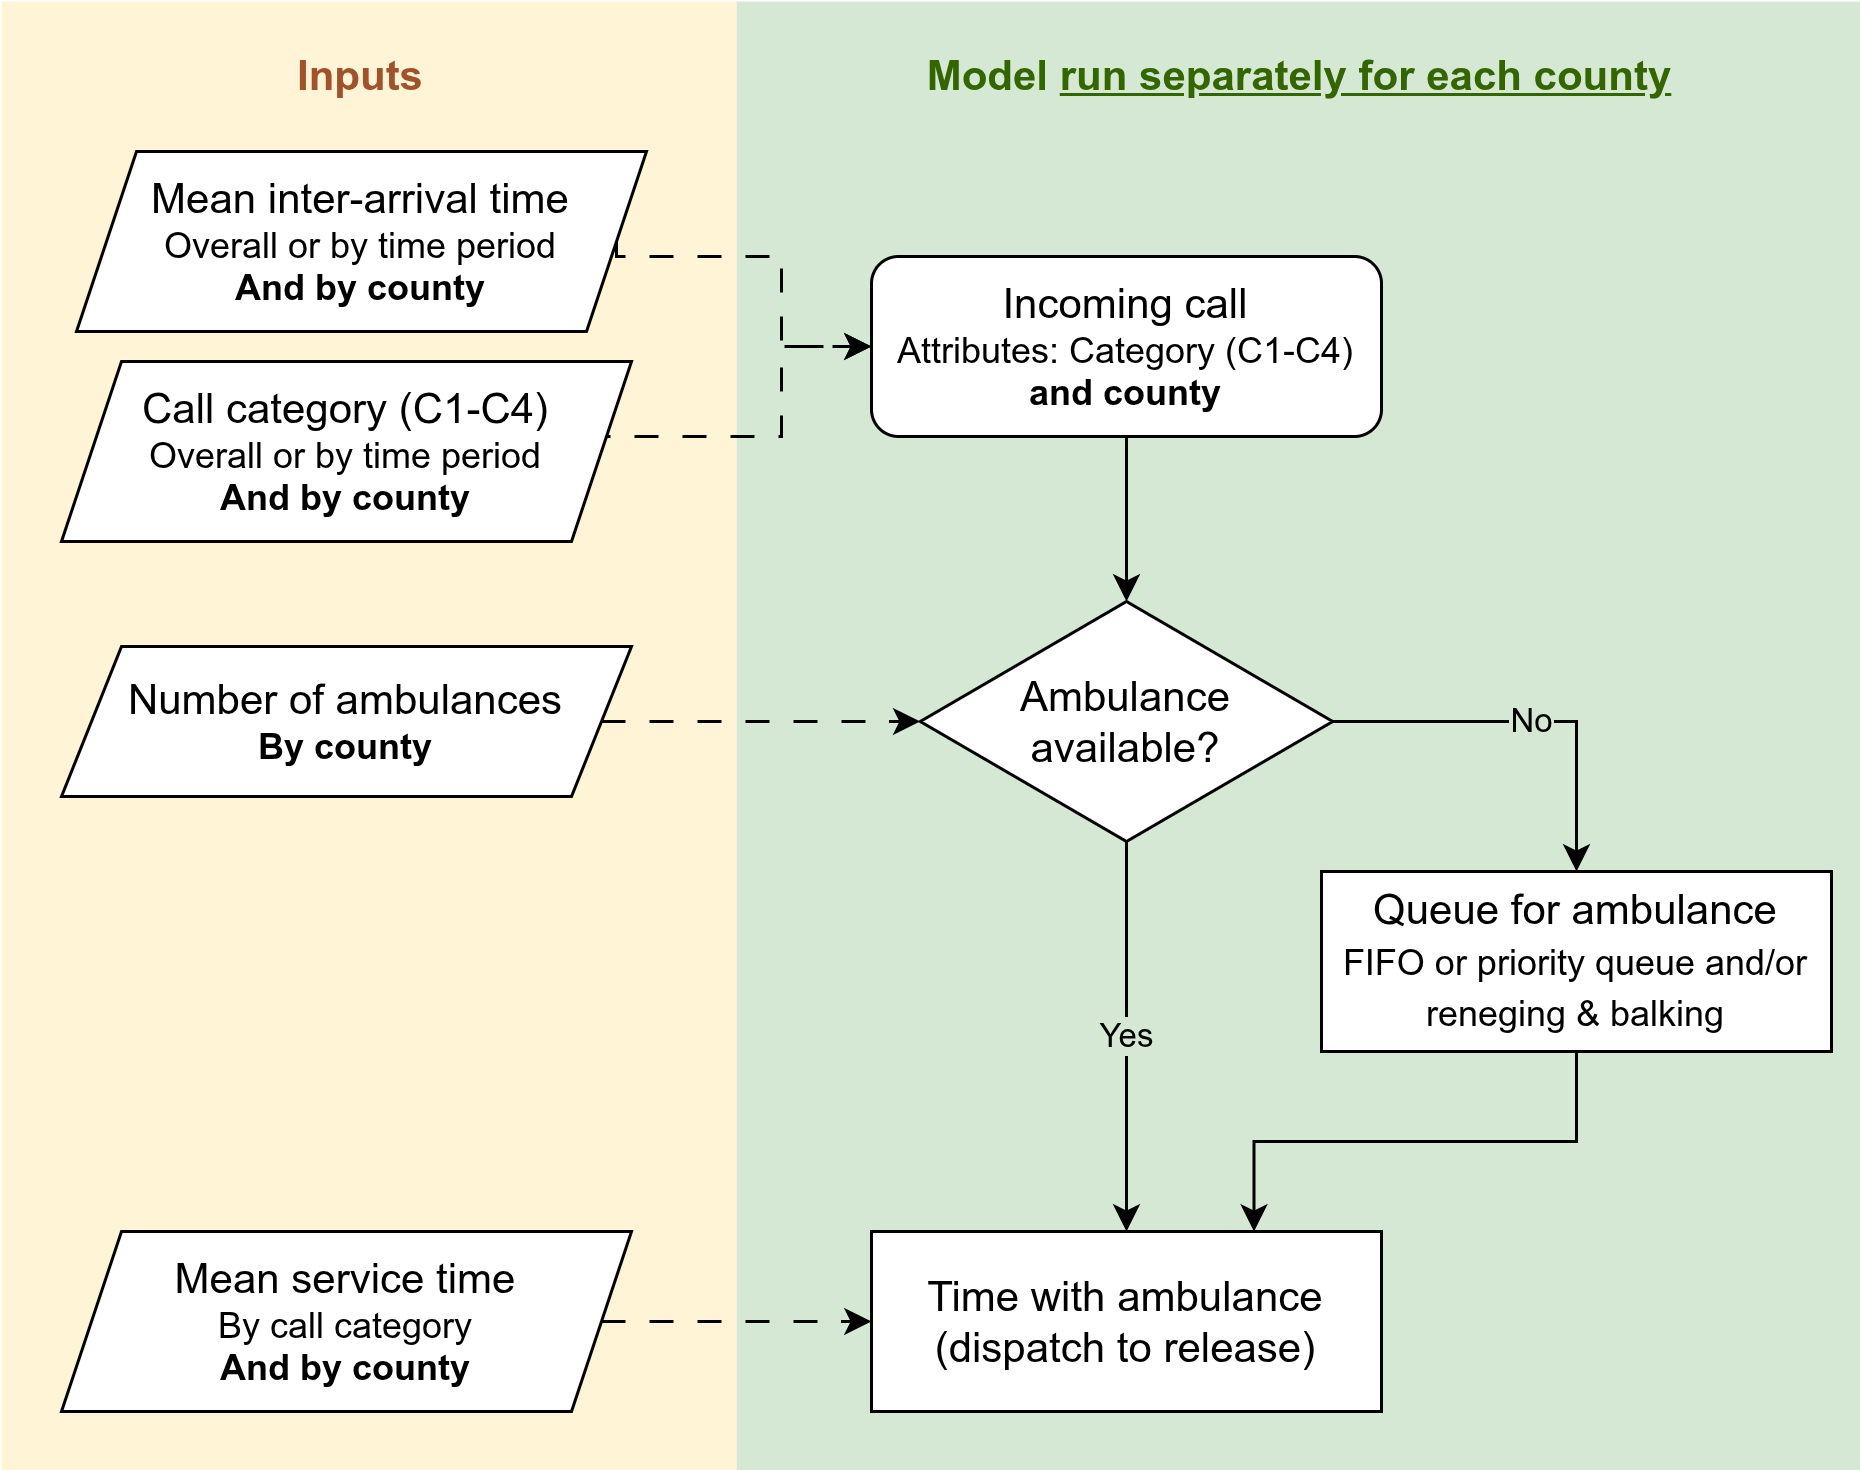
| Element | Description |
|---|---|
| Content | Same as stage 1 |
| Inputs | County-specific parameters for demand, resources and service times |
| Outputs | Same as stage 1 |
This is equivalent to having one model instance with separate ambulance resources per county, as then you’d just be running each county in parallel to each other essentially, no interaction, so it’s simpler to just use the single area model and run it for each county.
Notes
This will only be an approximation, and may potentially be quite bad. It ignores how counties ineract - we know there isn’t really one separate service per county, and that resources operate across counties on shift.
To discuss:
- Is this actually a question of interest? Or is it really just stage 5? Maybe should remove this?
Stage 3: Job cycle times
Key question
How do improvements in specific job-cycle components (e.g., scene time, handover) affect response time and utilisation?
Model changes
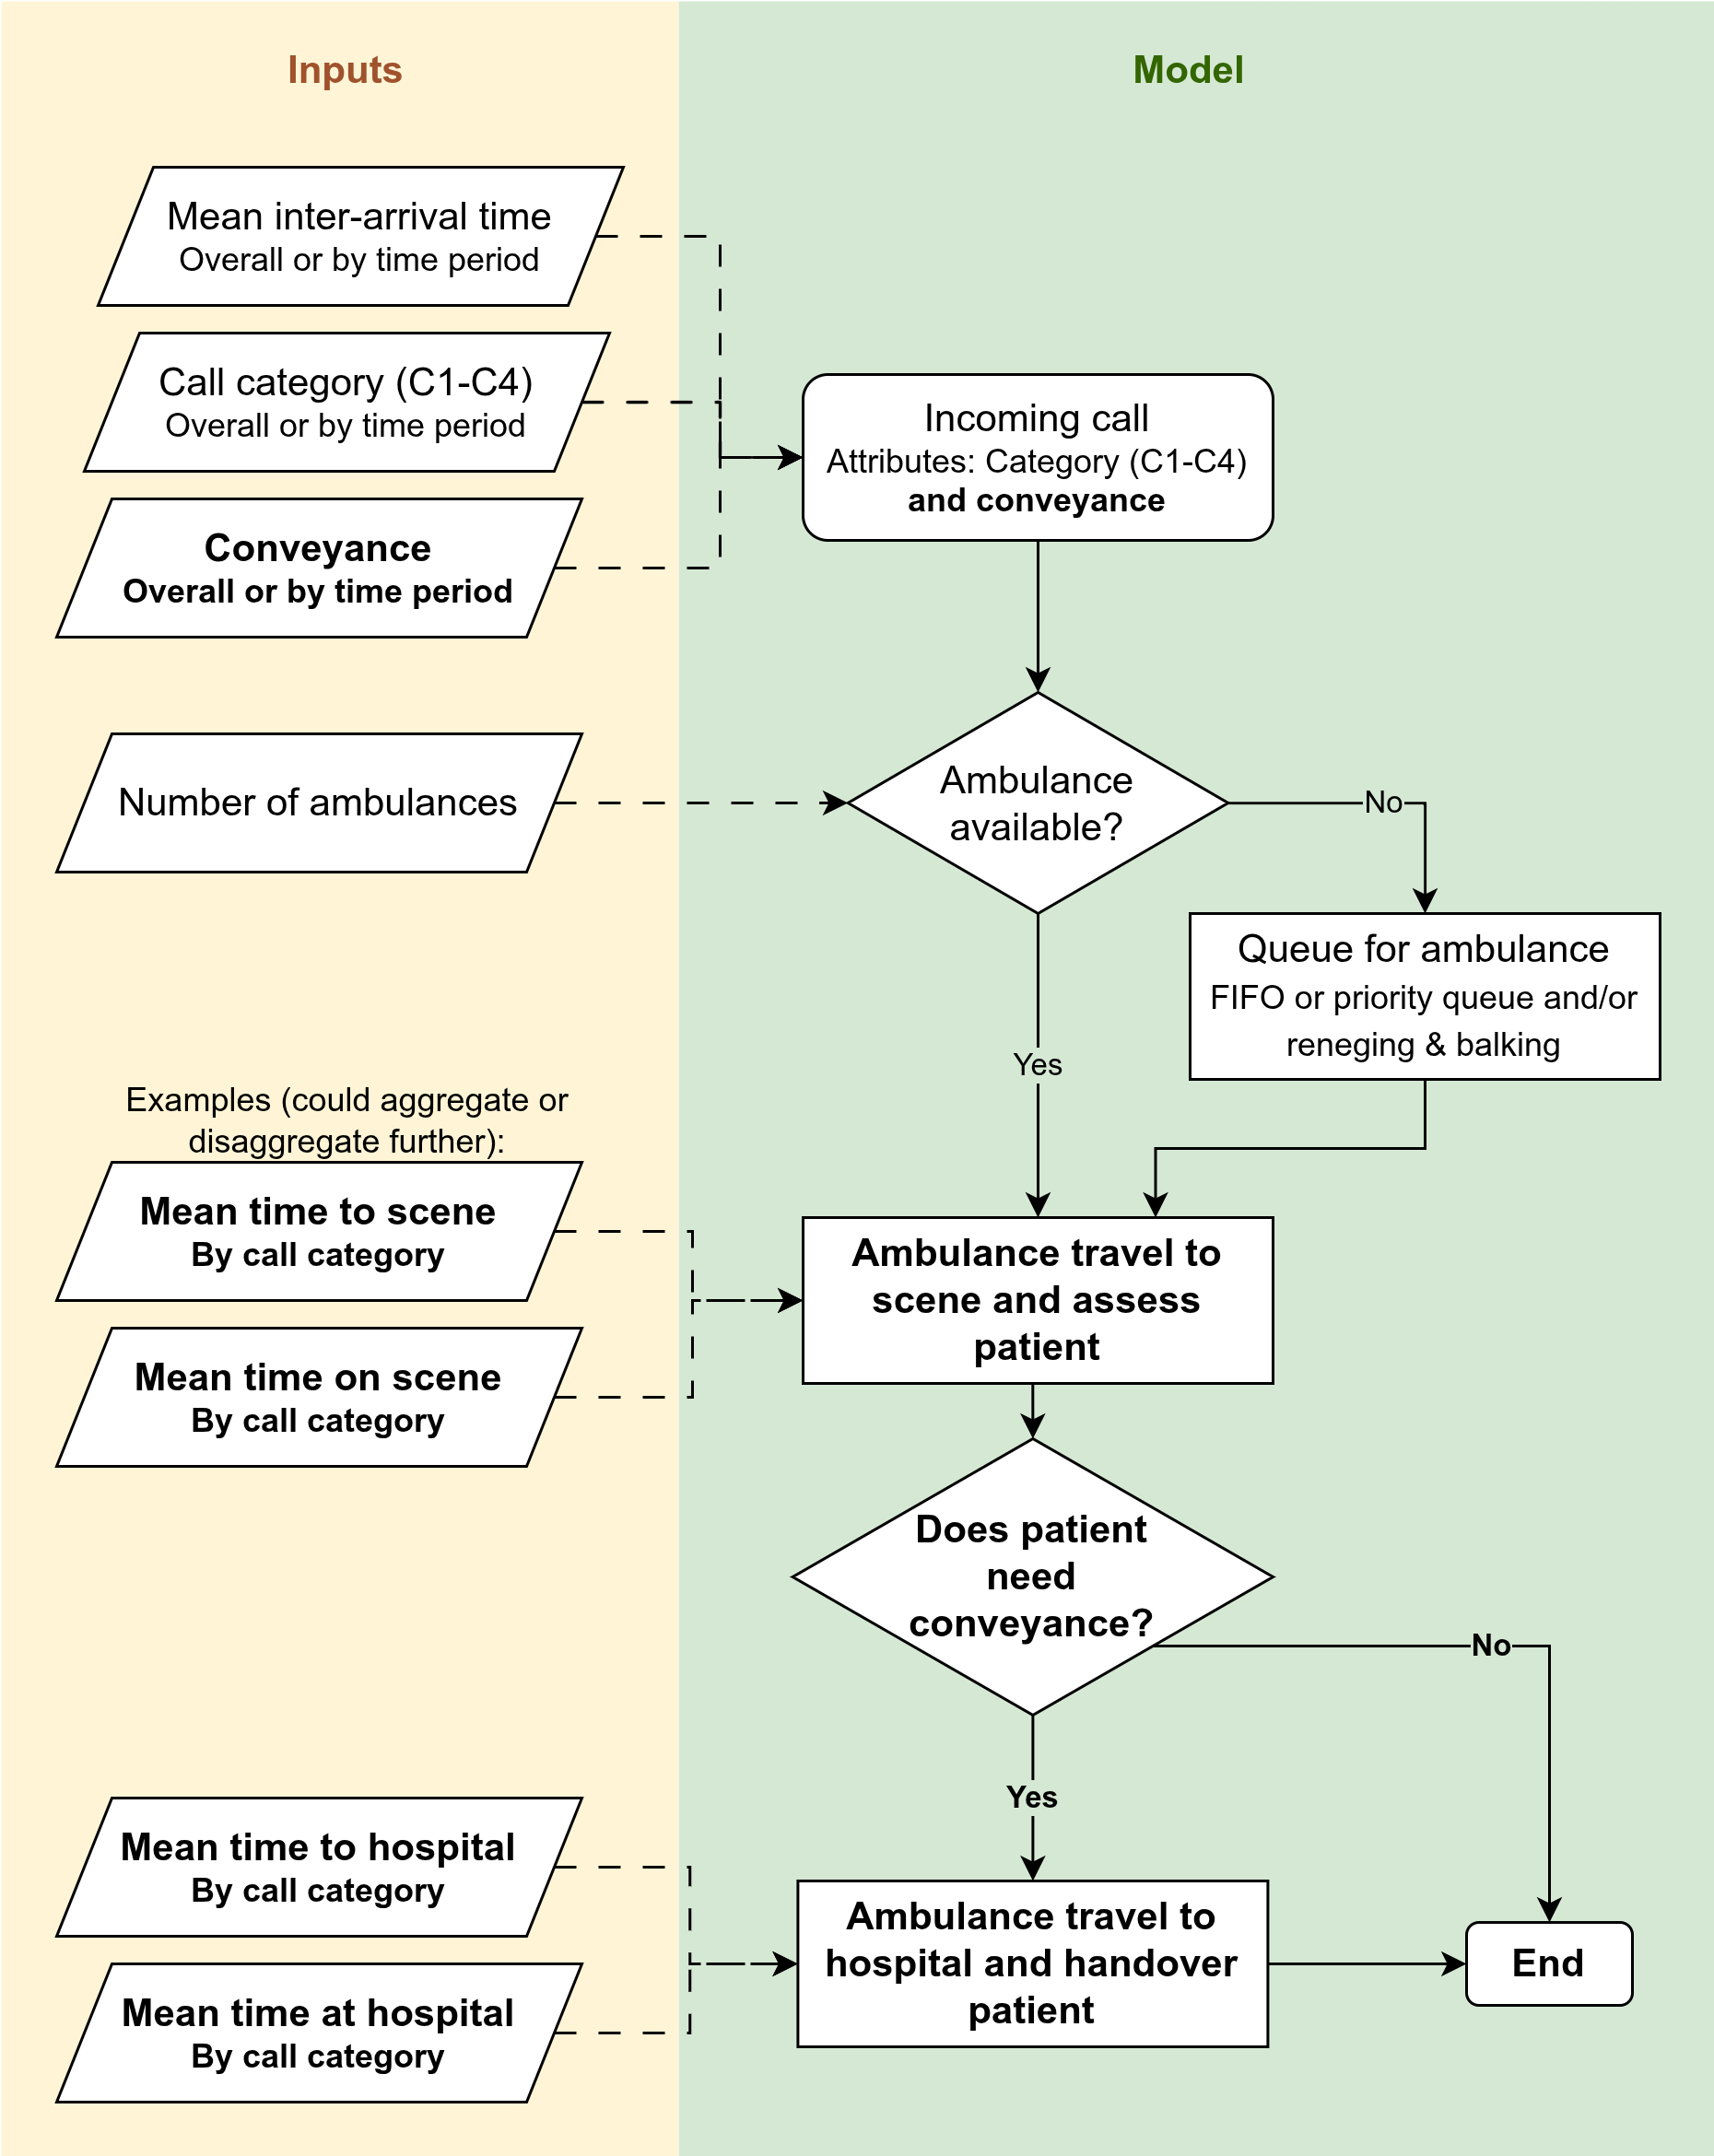
| Element | Description |
|---|---|
| Content | (1) Job cycle divided into individual time components (e.g., time on scene, handover time). (2) Separate cfycle times for conveyed v.s. non conveyed |
| Inputs | Cycle times and conveyed/nonconveyed breakdown of everything |
| Outputs | Also now report by conveyed and non conveyed |
Notes
To discuss:
- Does this continue from stage 1 or 2? I guess it depends if stage 2 is any good or not?
- Which job cycle times to model? Which to aggregate?
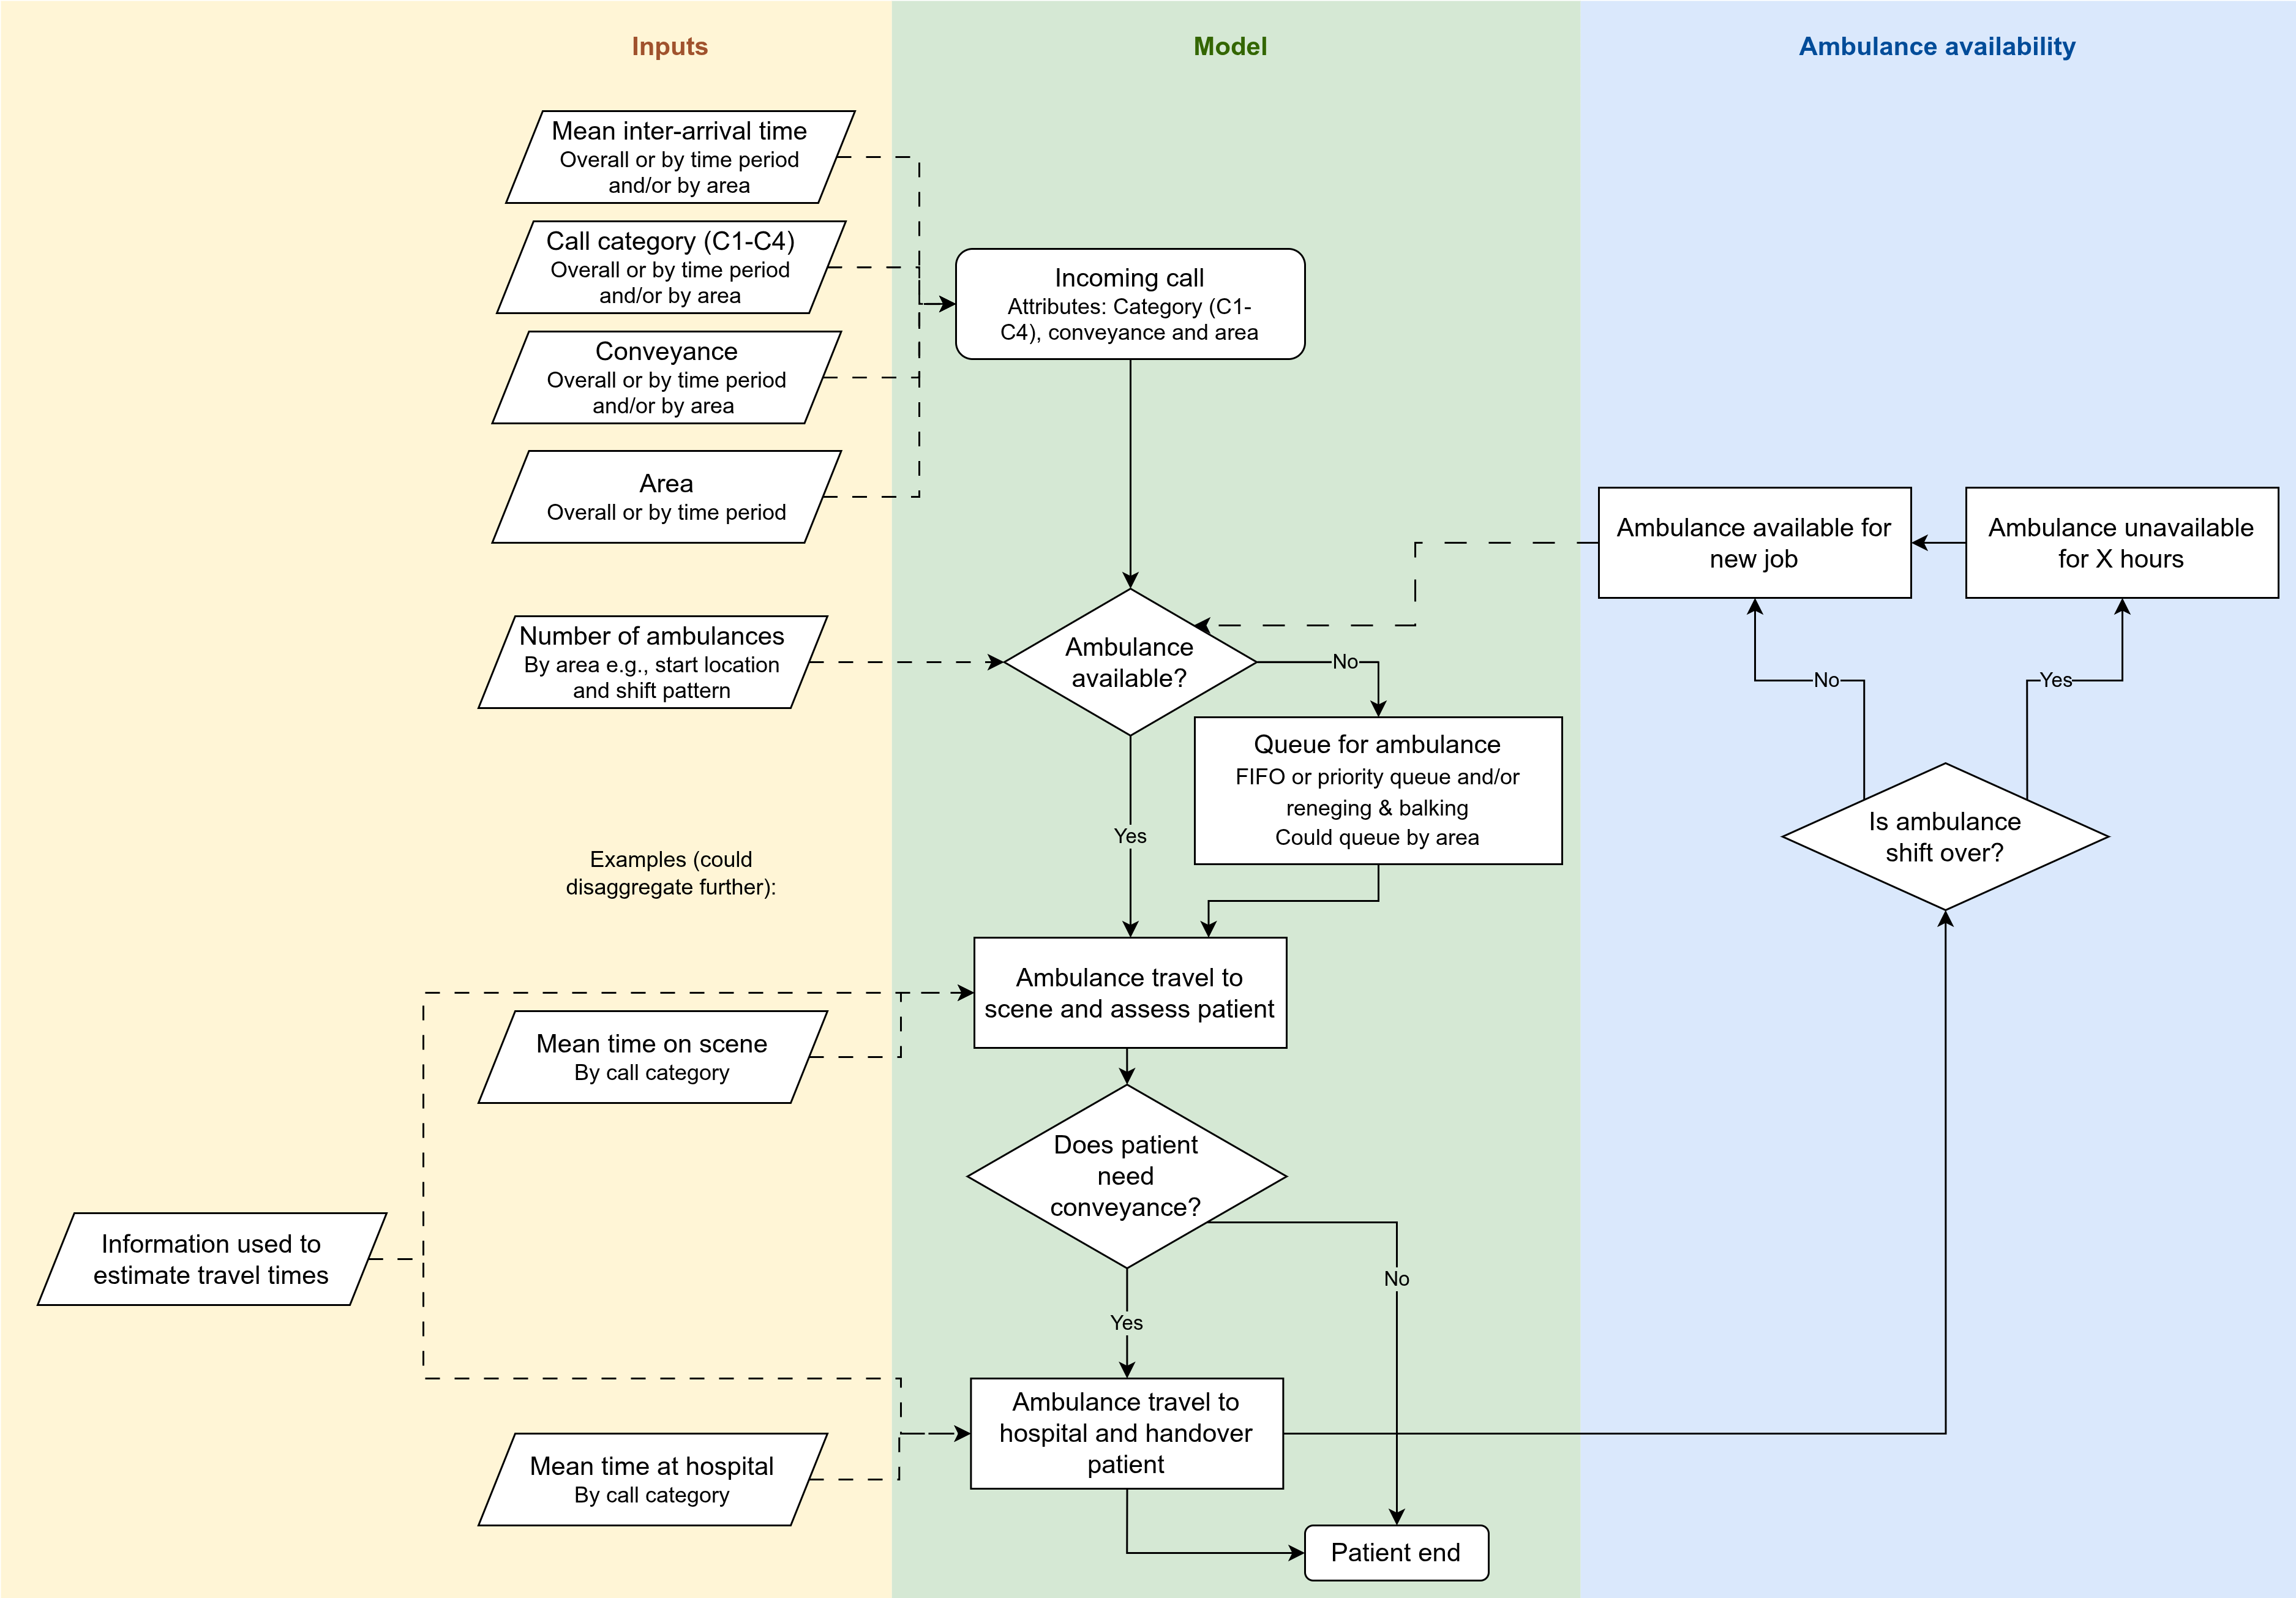
Stage 4: Shifts
Key question
Can alternative shift patterns (start times, staggering, breaks) smooth resource availability and improve response time and utilisation?
Current patterns is that many 12-hour shifts starting at 06:00 or 07:00. This means there are:
- Midday and midnight dips in resource numbers when many crews are on break at once.
- Effects of protected periods towards the end of shifts.
The focus here is on whether alternative rota patterns smooth the resource availability profile and improve response time and utilisation.
Model changes
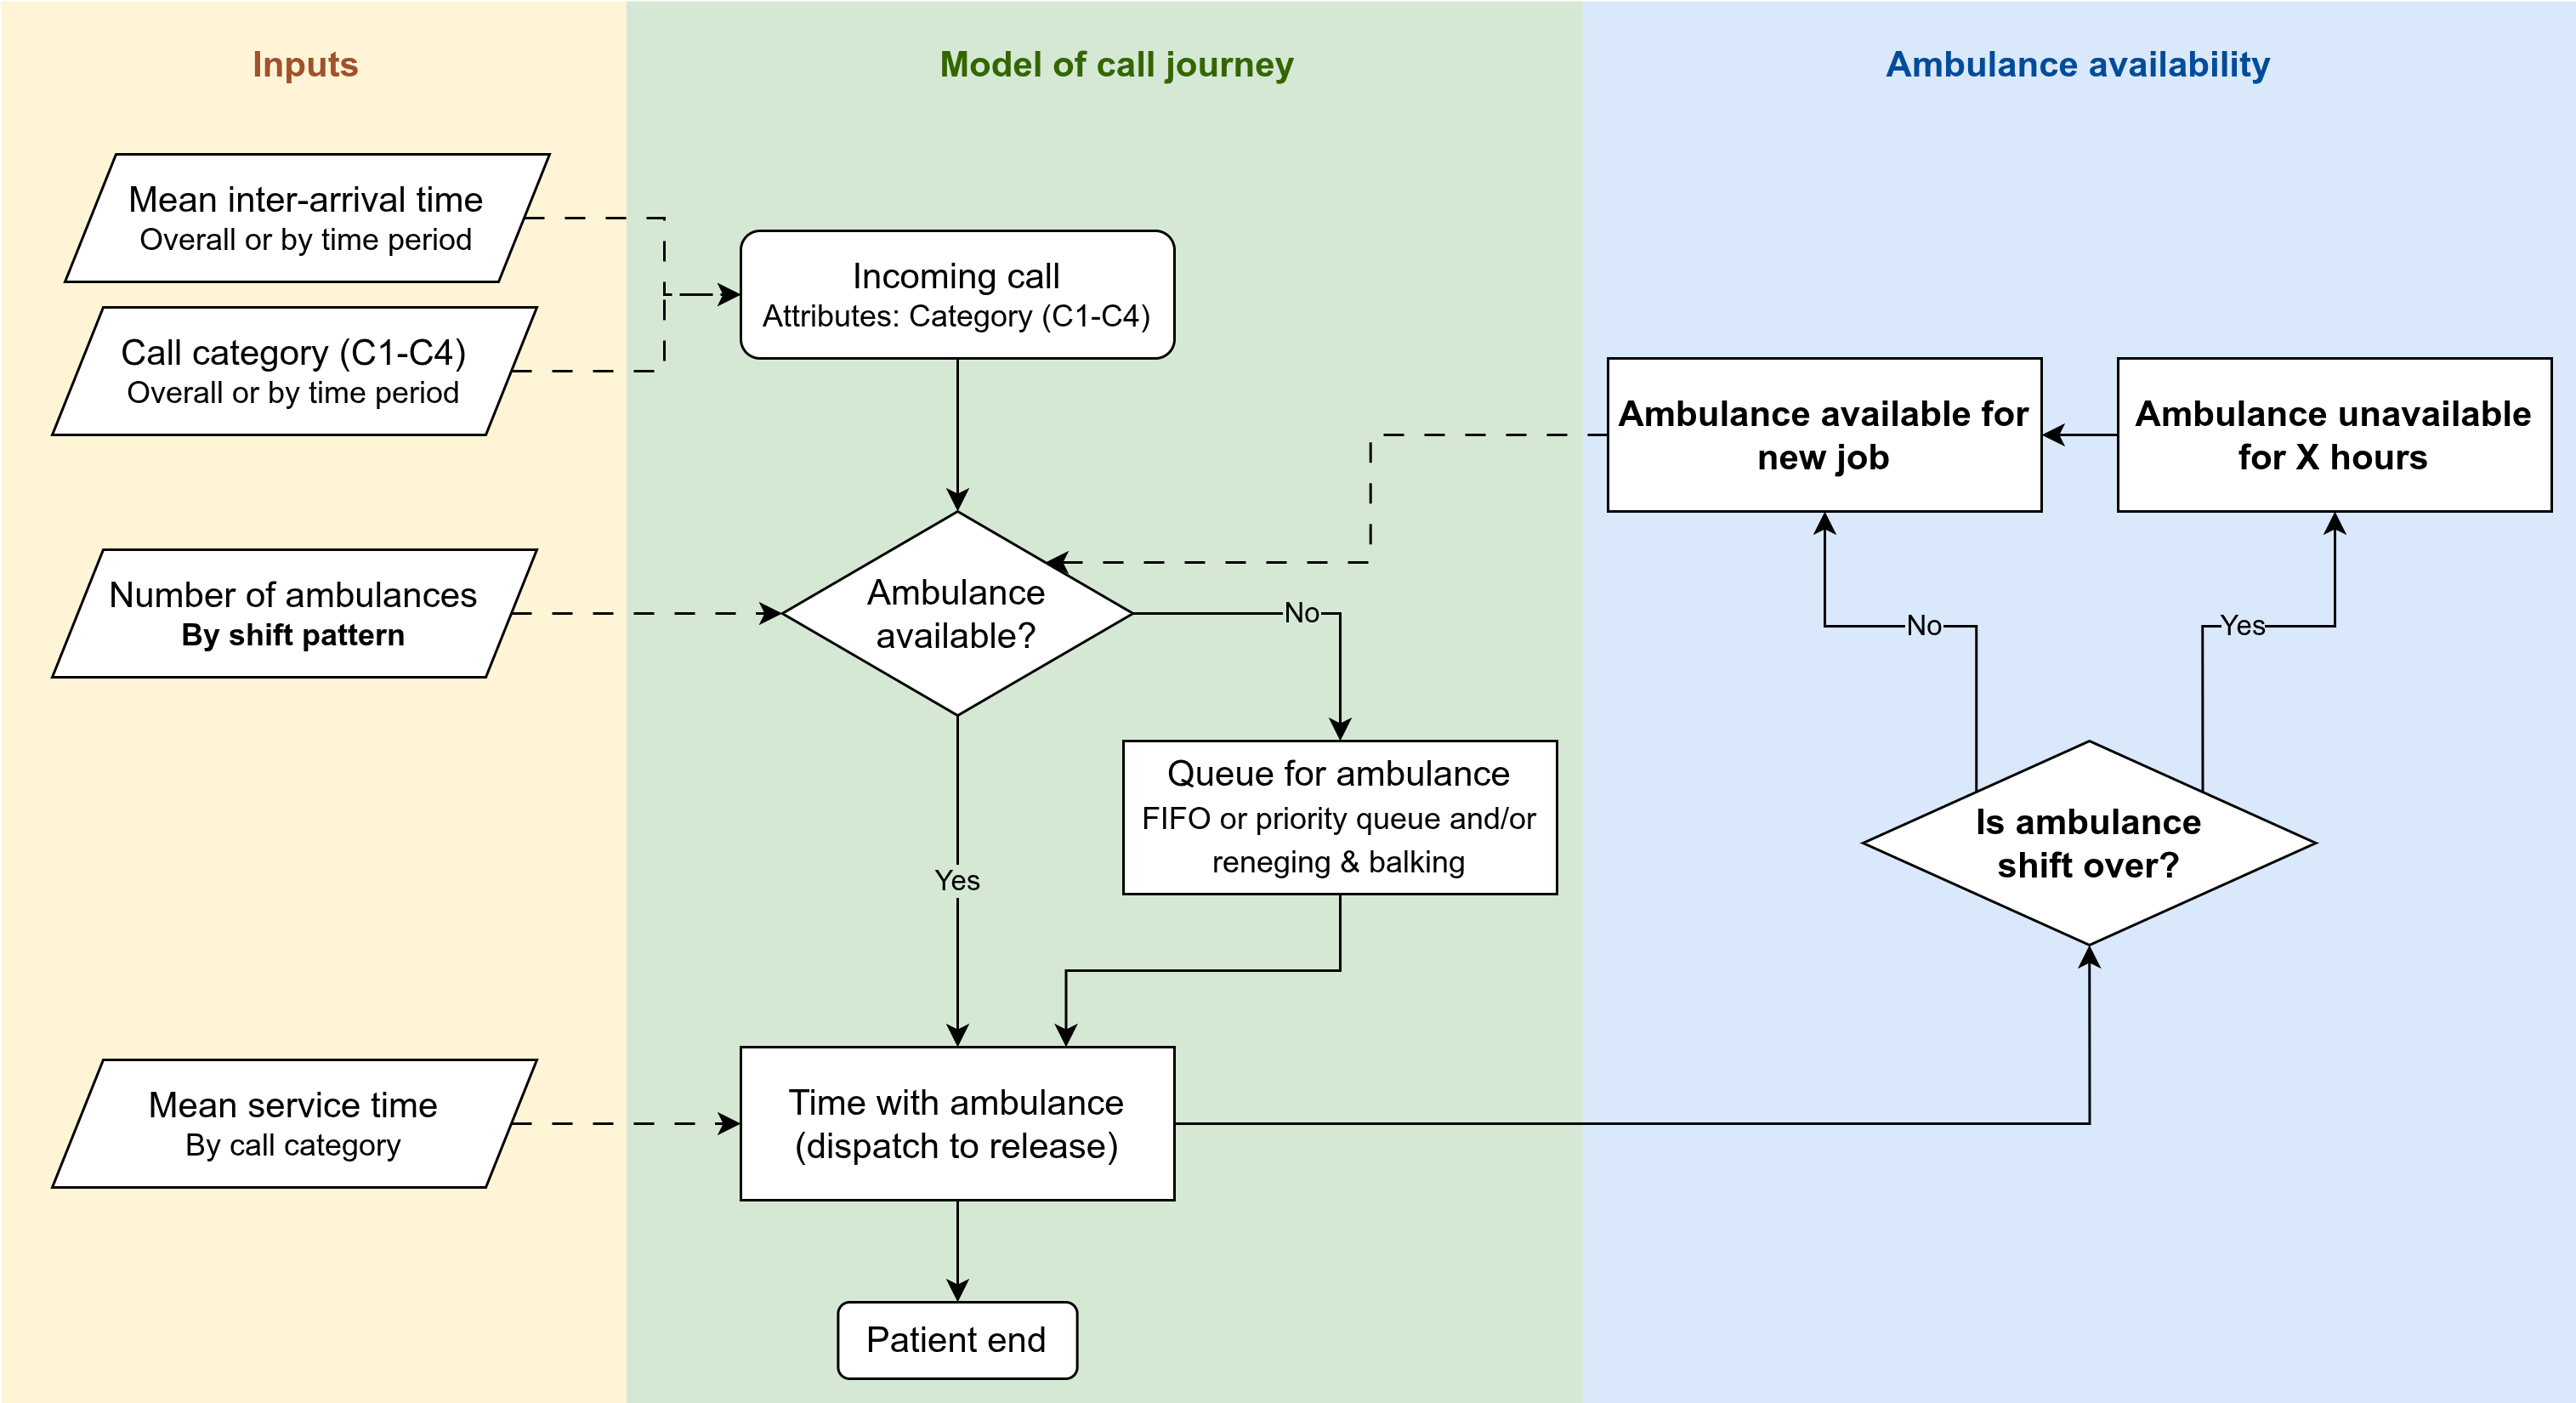
| Element | Description |
|---|---|
| Content | Add representation of shifts (resource availability over time), including breaks and protected periods |
| Inputs | Current and alternative rota schedules (for the whole area, not by station, proportions on different schedules) |
| Outputs | Add a new output: resource availability profile over the day (to see whether staggered shifts remove midday and midnight dips). |
Notes
To discuss:
- Does this question require understanding of county (stage 2) or job cycle (stage 3). If so, it builds on them. If not, it builds on stage 1.
- Relatedly, if stages 2-4 are all just iterations on stage 1, what is the priority order?
- What are the current break policies?
- Is it relevant to know proportion of crews going straight from one job to the next versus returning to station between jobs? Here or elsewhere?
- Also, is it relevant here (or elsewhere) to think about other outcomes relevant to wellbeing or finances like overtime and interruption of breaks.
- Outcomes and scenarios explored here - explore involving paramedics? As there is a big wellbeing aspect to this. Like PPI, but specifically involving paramedics, as it would impact them if decisions made. Do they already do that for decisions? (e.g., chatting with Luke, frequently stuck on overtime due to late cat1, and always never return to base always straight to next job)
- Cost… I think this is maybe stage where starts to be relevant? You could attach simple cost estimates (e.g. staff and vehicle costs) to each resourcing or shift scenario + overtime etc. Purpose would be to understand cost implications of options that improve performance. Maybe its relevant to stage 1 and 2 as well though - high level estimate of operating cost under different scenarios
Stage 5: Resourcing by county (with interaction)
Key question
When vehicle hours change in one county, how are response time and utilisation affected both locally and in neighbouring counties?
Model changes
This builds on stage 3, as we have travel times to scene and to hospital, and then job cycle times at scene and at hospital.
Introduce geographic modelling. Possible configurations:
- Counties as zones with local queues and spillover rules.
- Breaking down into smaller than county level
Resources become linked to area.
Brings with it possible changes to e.g., travel times (as can estimate now based on distance), and demand profiles (e.g., vary by area)
Notes
To discuss:
There will be alot to figure here about how to do things, but can address at later stage.
- E.g. Whether do times, catetgories and conveyance by area.
- Where ambulances start from and where they go after release.
- How we model travel times.
Other things to consider would be:
- What size area is required to answer this question?
- Does this question require shifts in the model?
- If yes, it builds from stage 4 (as represented in current diagram), If no, it builds from stage 3.
- Socioeconomic inequalities - either with stage 5 (though may be too broad) or 6 - we know inequalities exist - we could use the model to ask, which changes reduce the worst gaps in response times, not just average. it ties in with AACE and NHSE about reducing inequalities not just hitting targets. so outcome is not just overall reduce cat 2, but about gap in cat 2 response between more and less deprived. sometimes inequality is about rural rather than socioeconomic. Change is basically, in analysis of model results, can label areas… deprivation.. rural urban… known baseline mean response time dispartieeis… then see change from scenarios. you could embed in model itself if wanted to do optimisation.
Stage 6: Station-level questions
Key question
What is the impact of adding/moving/removing individual station shifts?
For example, identifying stations with low utilisation, as candidates.
Model changes
This requires representing individual stations explicitly. And linking resources to those.
It requires stage 4 and stage 5 components and essentially merges those. Depending on how model a station and what incorporate in stage 5, may not be super different. Just requires sufficiently small areas to represent different stations.
Notes
To discuss:
- Depends on stage 5, whether this is new or not.
- New if stage 5 is big areas.
- Not a stage if stage 5 already requires small areas.
Assumptions and simplifications
To reflect on and document. Things like:
- Multiple vehicles attending the same incident - not modelling that (should you?)
- Including/excluding see-and-treat and hear-and-treat
- Out of ambulance service patch
- Not modelling hospital capacity (AmbModelOpen did that)