# Using ambforecast
This repository contains the open-source forecasting code and simple examples showing how to use its main functions.
Making the code open supports transparency, reproducibility, and reuse. It allows others to understand how the forecasts are produced, test and improve the methods, and adapt them for other ambulance services or similar forecasting problems.
The full analysis using real ambulance service data is carried out in the separate private `ambforecast-private` repository. Private analysis outputs are not included here.
# Imports
``` python
import numpy as np
import pandas as pd
from ambforecast.arima import ARIMAParams, arima
from ambforecast.ensemble import ensemble
from ambforecast.errors import calculate_errors
from ambforecast.forecast import (
run_single_forecast, run_forecasts, run_cross_validation
)
from ambforecast.plot import plot_forecast, plot_cross_validation
from ambforecast.preprocessing import (
prepare_historic, prepare_holidays, prepare_temp,
validate_historic, validate_holidays, validate_temp, interpolate_temp
)
from ambforecast.prophet import ProphetParams, prophet, ProphetRegressor
from ambforecast.naive import SNaiveParams, snaive
from ambforecast.splits import train_test_split
```
# Synthetic data
Code
``` python
rng = np.random.default_rng(42)
dates = pd.date_range("2022-01-01", "2024-12-31", freq="D")
areas = ["Cornwall", "Devon", "Somerset"]
metrics = ["Calls", "Incidents", "Responses"]
# Synthetic daily temperature data, one observation per area per day.
raw_temp = pd.DataFrame(
[
{
"OB_END_TIME": date + pd.Timedelta(hours=12),
"ID_TYPE": "WMO",
"ID": f"{area[:3].upper()}_001",
"OB_HOUR_COUNT": 12,
"VERSION_NUM": 1,
"MET_DOMAIN_NAME": "SYNTHETIC_UK",
"SRC_ID": f"SYN_{area[:3].upper()}",
"MAX_AIR_TEMP": round(12 + 8 * np.sin(2 * np.pi * date.dayofyear / 365) + rng.normal(0, 2), 1),
"MIN_AIR_TEMP": round(5 + 6 * np.sin(2 * np.pi * date.dayofyear / 365) + rng.normal(0, 2), 1),
"ICB": area,
}
for date in dates
for area in areas
]
)
# A few simple holidays, repeated for every area.
holiday_dates = {
"new_year": "01-01",
"christmas": "12-25",
"boxing_day": "12-26",
}
raw_holidays = pd.DataFrame(
[
{
"ds": pd.Timestamp(f"{year}-{month_day}"),
"holiday": holiday,
"lower_window": 0,
"upper_window": 1,
"county": area,
}
for year in range(2022, 2025)
for holiday, month_day in holiday_dates.items()
for area in areas + ["Trust"]
]
)
# Synthetic daily demand. It has weekly seasonality, annual seasonality,
# a small weather effect, a holiday effect, and random noise.
daily_temp = (
raw_temp.assign(ds=raw_temp["OB_END_TIME"].dt.normalize())
.groupby(["ds", "ICB"], as_index=False)["MAX_AIR_TEMP"]
.mean()
)
raw_historic = []
for metric, baseline in {"Calls": 100, "Incidents": 65, "Responses": 55}.items():
for area, multiplier in {"Cornwall": 0.8, "Devon": 1.0, "Somerset": 0.6}.items():
area_temp = daily_temp[daily_temp["ICB"] == area].set_index("ds")
for date in dates:
is_holiday = ((raw_holidays["ds"] == date) & (raw_holidays["county"] == area)).any()
weekly = [1.0, 0.95, 0.95, 0.98, 1.05, 1.12, 1.08][date.dayofweek]
yearly = 1 + 0.1 * np.sin(2 * np.pi * date.dayofyear / 365)
heat = max(area_temp.loc[date, "MAX_AIR_TEMP"] - 20, 0) * 0.03
y = baseline * multiplier * weekly * yearly * (1 + heat)
y *= 1.1 if is_holiday else 1
raw_historic.append(
{"ds": date, "currency": metric, "ora": area, "y": round(max(0, y + rng.normal(0, 8)))}
)
raw_historic = pd.DataFrame(raw_historic)
```
``` python
display(raw_historic.head())
```
| | ds | currency | ora | y |
|-----|------------|----------|----------|-----|
| 0 | 2022-01-01 | Calls | Cornwall | 103 |
| 1 | 2022-01-02 | Calls | Cornwall | 73 |
| 2 | 2022-01-03 | Calls | Cornwall | 68 |
| 3 | 2022-01-04 | Calls | Cornwall | 80 |
| 4 | 2022-01-05 | Calls | Cornwall | 61 |
``` python
display(raw_holidays.head())
```
| | ds | holiday | lower_window | upper_window | county |
|-----|------------|-----------|--------------|--------------|----------|
| 0 | 2022-01-01 | new_year | 0 | 1 | Cornwall |
| 1 | 2022-01-01 | new_year | 0 | 1 | Devon |
| 2 | 2022-01-01 | new_year | 0 | 1 | Somerset |
| 3 | 2022-01-01 | new_year | 0 | 1 | Trust |
| 4 | 2022-12-25 | christmas | 0 | 1 | Cornwall |
``` python
display(raw_temp.head())
```
| | OB_END_TIME | ID_TYPE | ID | OB_HOUR_COUNT | VERSION_NUM | MET_DOMAIN_NAME | SRC_ID | MAX_AIR_TEMP | MIN_AIR_TEMP | ICB |
|----|----|----|----|----|----|----|----|----|----|----|
| 0 | 2022-01-01 12:00:00 | WMO | COR_001 | 12 | 1 | SYNTHETIC_UK | SYN_COR | 12.7 | 3.0 | Cornwall |
| 1 | 2022-01-01 12:00:00 | WMO | DEV_001 | 12 | 1 | SYNTHETIC_UK | SYN_DEV | 13.6 | 7.0 | Devon |
| 2 | 2022-01-01 12:00:00 | WMO | SOM_001 | 12 | 1 | SYNTHETIC_UK | SYN_SOM | 8.2 | 2.5 | Somerset |
| 3 | 2022-01-02 12:00:00 | WMO | COR_001 | 12 | 1 | SYNTHETIC_UK | SYN_COR | 12.5 | 4.6 | Cornwall |
| 4 | 2022-01-02 12:00:00 | WMO | DEV_001 | 12 | 1 | SYNTHETIC_UK | SYN_DEV | 12.2 | 3.5 | Devon |
# Pre-processing
``` python
df_historic = prepare_historic(data=raw_historic)
display(df_historic.head())
validate_historic(data=df_historic)
```
| | ds | metric | area | y |
|------|------------|-----------|----------|-----|
| 0 | 2022-01-01 | Calls | Cornwall | 103 |
| 3288 | 2022-01-01 | Incidents | Cornwall | 69 |
| 6576 | 2022-01-01 | Responses | Cornwall | 48 |
| 1096 | 2022-01-01 | Calls | Devon | 132 |
| 4384 | 2022-01-01 | Incidents | Devon | 59 |
✅ No problems identified in historic data.
``` python
df_holidays = prepare_holidays(raw_holidays)
display(df_holidays.head())
validate_holidays(df_holidays)
```
| | ds | holiday | lower_window | upper_window | area |
|-----|------------|-----------|--------------|--------------|----------|
| 0 | 2022-01-01 | new_year | 0 | 1 | Cornwall |
| 1 | 2022-01-01 | new_year | 0 | 1 | Devon |
| 2 | 2022-01-01 | new_year | 0 | 1 | Somerset |
| 3 | 2022-01-01 | new_year | 0 | 1 | Trust |
| 4 | 2022-12-25 | christmas | 0 | 1 | Cornwall |
✅ No problems identified in holiday data.
``` python
temp = prepare_temp(raw_temp)
temp = interpolate_temp(temp)
display(temp.head())
validate_temp(temp)
```
| | ds | area | MIN_AIR_TEMP | MAX_AIR_TEMP |
|-----|------------|----------|--------------|--------------|
| 0 | 2022-01-01 | Cornwall | 3.0 | 12.7 |
| 1 | 2022-01-01 | Devon | 7.0 | 13.6 |
| 2 | 2022-01-01 | Somerset | 2.5 | 8.2 |
| 3 | 2022-01-01 | Trust | 2.5 | 13.6 |
| 4 | 2022-01-02 | Cornwall | 4.6 | 12.5 |
✅ No problems identified in air temperature data.
# Forecasting options
## Running the forecast
The package provides three functions for running forecasts:
- [run_single_forecast()](../reference/forecast.run_single_forecast.md#ambforecast.forecast.run_single_forecast) forecasts one metric and area (e.g., `Calls` in `Cornwall`).
- [run_forecasts()](../reference/forecast.run_forecasts.md#ambforecast.forecast.run_forecasts) forecasts every metric and area in a dataset.
- [run_cross_validation()](../reference/forecast.run_cross_validation.md#ambforecast.forecast.run_cross_validation) - evaluate a model using rolling forecast origin cross-validation.
[run_single_forecast()](../reference/forecast.run_single_forecast.md#ambforecast.forecast.run_single_forecast) and [run_forecasts()](../reference/forecast.run_forecasts.md#ambforecast.forecast.run_forecasts) can be used in two ways:
- **Forecast future demand:** provide `horizon` which is the number of days to forecast beyond the final date in the provided data.
- **Evaluate against held-out demand:** split the historic data into train and test datasets using [train_test_split()](../reference/splits.train_test_split.md#ambforecast.splits.train_test_split), then provide `test` so forecast dates are taken from the test dataset, and the forecast can be compared with observed values.
[run_forecasts()](../reference/forecast.run_forecasts.md#ambforecast.forecast.run_forecasts) and [run_cross_validation()](../reference/forecast.run_cross_validation.md#ambforecast.forecast.run_cross_validation) can run sequentially with `cores=1` or in parallel by setting `cores` to a larger number of `-1` to use all available cores.
## Models
Each forecasting model is implemented in its own module with:
- A **dataclass** for storing that model's settings.
- A **function** for fitting the model and generating forecasts.
Dataclasses are used as:
- Group model settings together in one named object, making experiments easy to read and reproduce.
- Avoid large function calls containing many settings - just pass the object.
- Document the available settings. Dataclass docstrings can include notes on what each parameter means and how it affects the model.
## Visualisation and evaluation
A few different functions are provided in the `plots` module for visualising the forecast results.
To evaluate forecast accuracy, use [calculate_errors()](../reference/errors.calculate_errors.md#ambforecast.errors.calculate_errors).
# Examples
These are a few examples of how to run forecasts. For internal team members, comprehensive use of the functions can be view in the `ambforecast-private` repository.
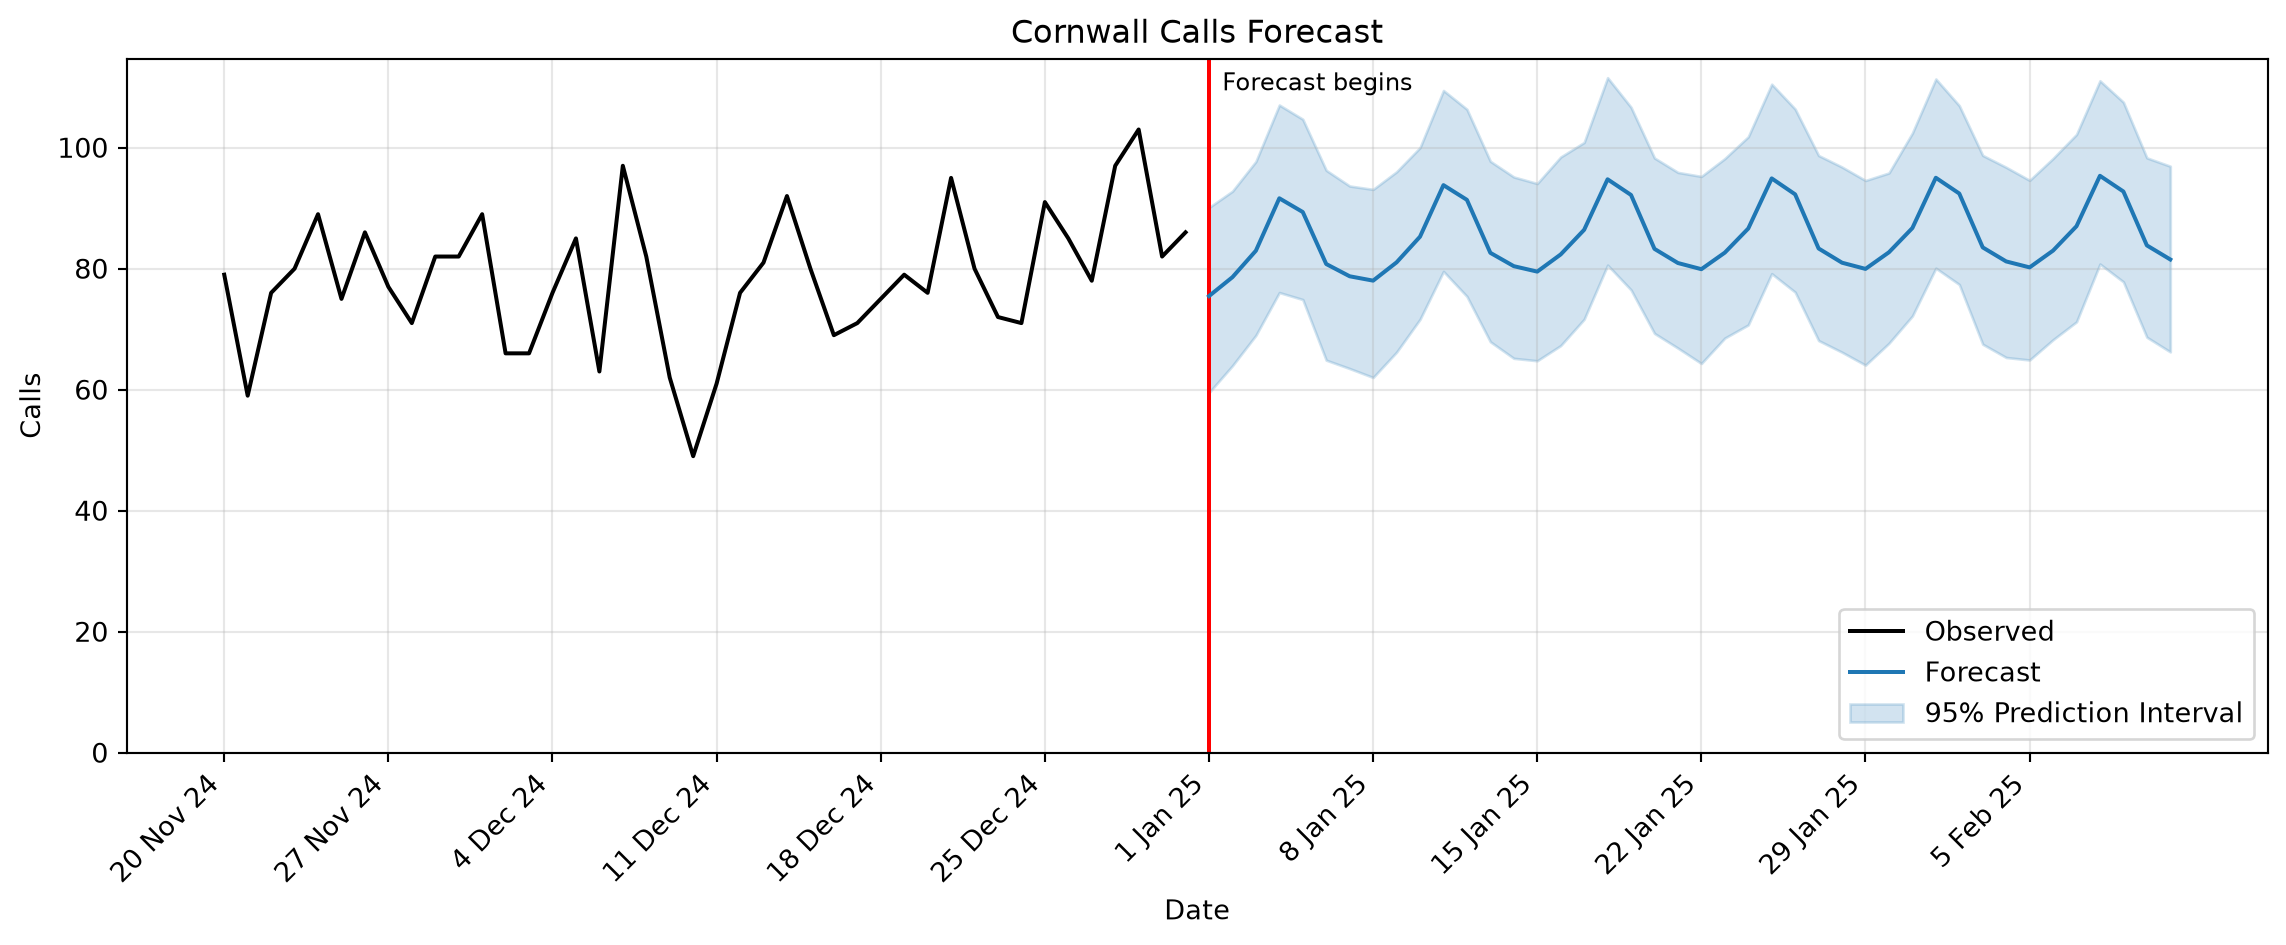
## Example 1: Single Prophet forecast of future
``` python
params = ProphetParams(
holidays=df_holidays
)
forecast = run_single_forecast(
forecast_function=prophet,
train=df_historic,
params=params,
metric="Calls",
area="Cornwall",
horizon=42
)
plot_forecast(
train=df_historic,
forecast=forecast
)
```
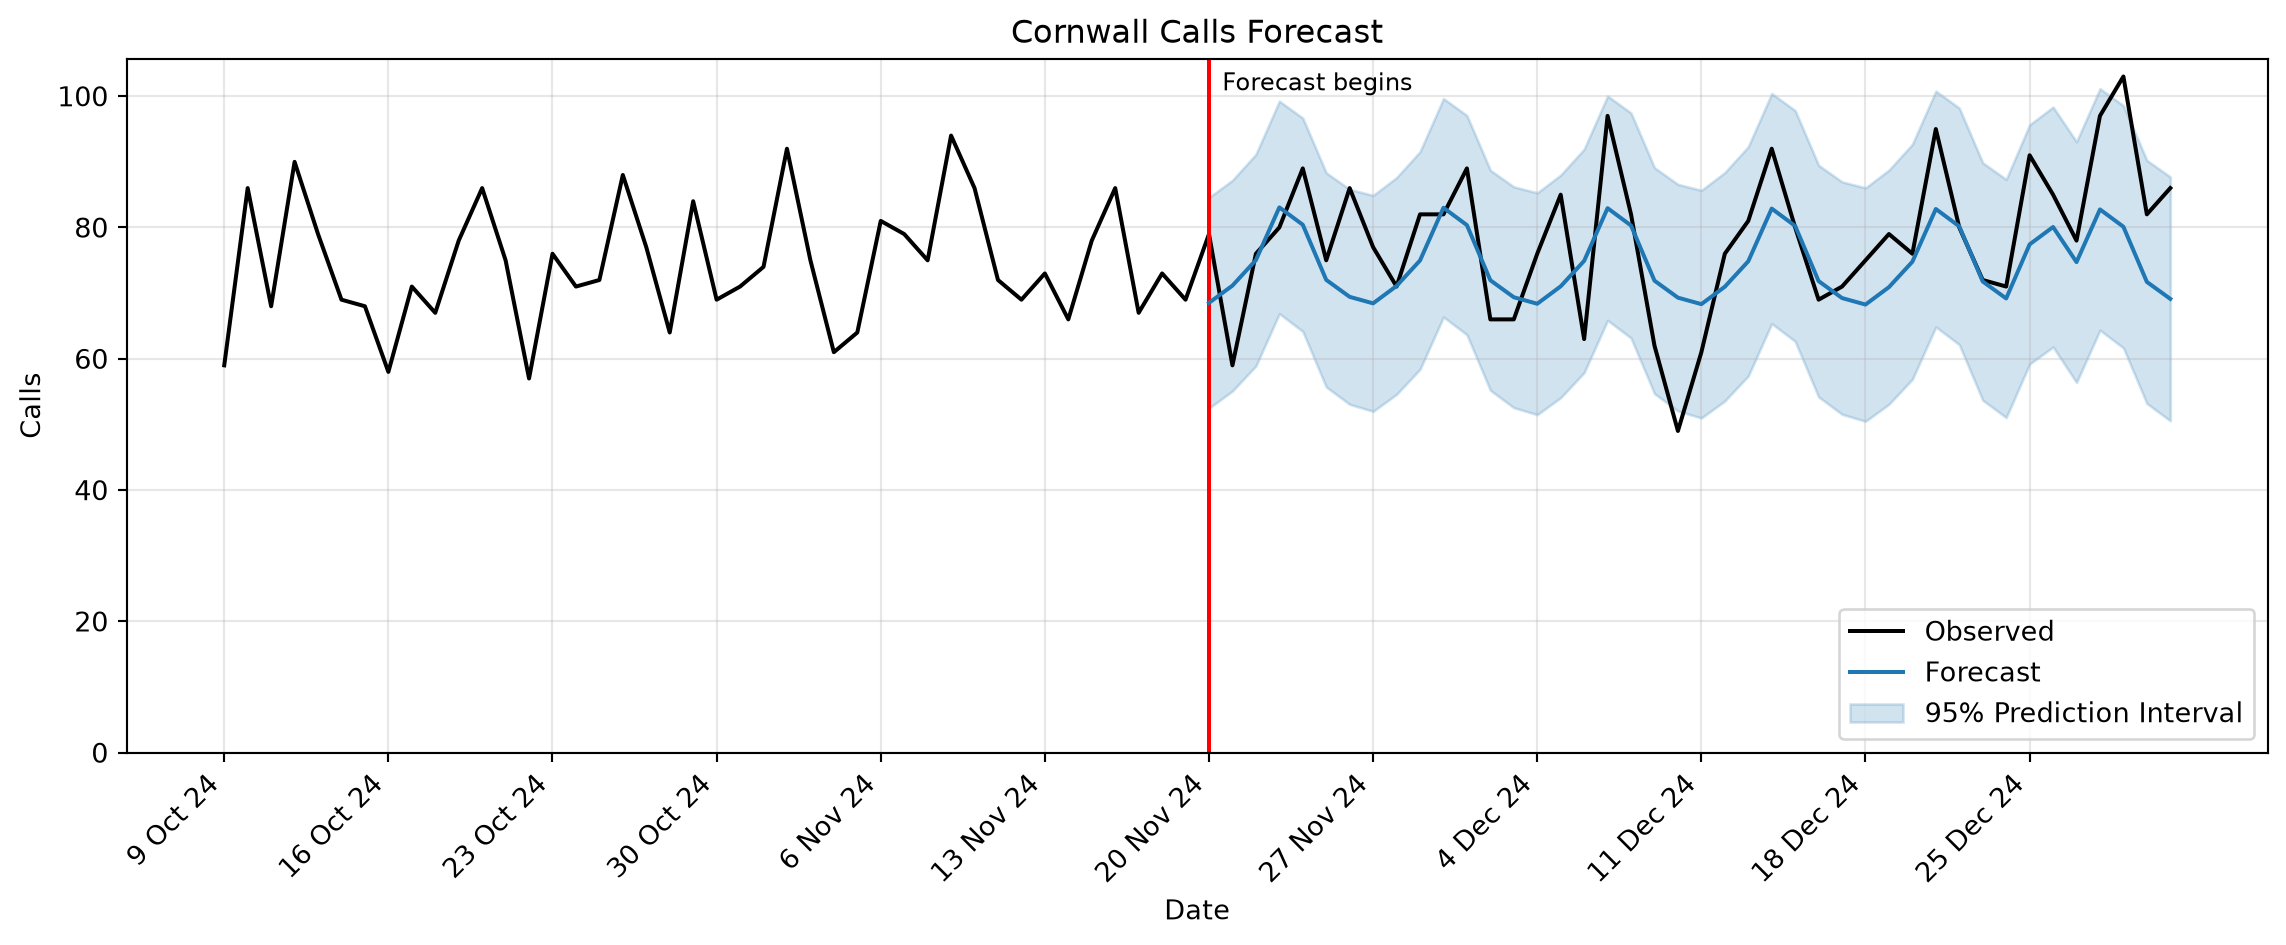
## Example 2: ARIMA forecasts for all areas with hold-out test set
``` python
train, test = train_test_split(data=df_historic, horizon=42)
params = ARIMAParams(
holidays=df_holidays,
order=(1, 1, 3),
seasonal_order=(1, 0, 1, 7)
)
forecast = run_forecasts(
forecast_function=arima,
train=train,
params=params,
test=test,
cores=1
)
plot_forecast(
train=train,
forecast=forecast,
test=test,
metric="Calls",
area="Cornwall"
)
```

## Example 2: ARIMA forecasts for all areas with hold-out test set
``` python
train, test = train_test_split(data=df_historic, horizon=42)
params = ARIMAParams(
holidays=df_holidays,
order=(1, 1, 3),
seasonal_order=(1, 0, 1, 7)
)
forecast = run_forecasts(
forecast_function=arima,
train=train,
params=params,
test=test,
cores=1
)
plot_forecast(
train=train,
forecast=forecast,
test=test,
metric="Calls",
area="Cornwall"
)
```
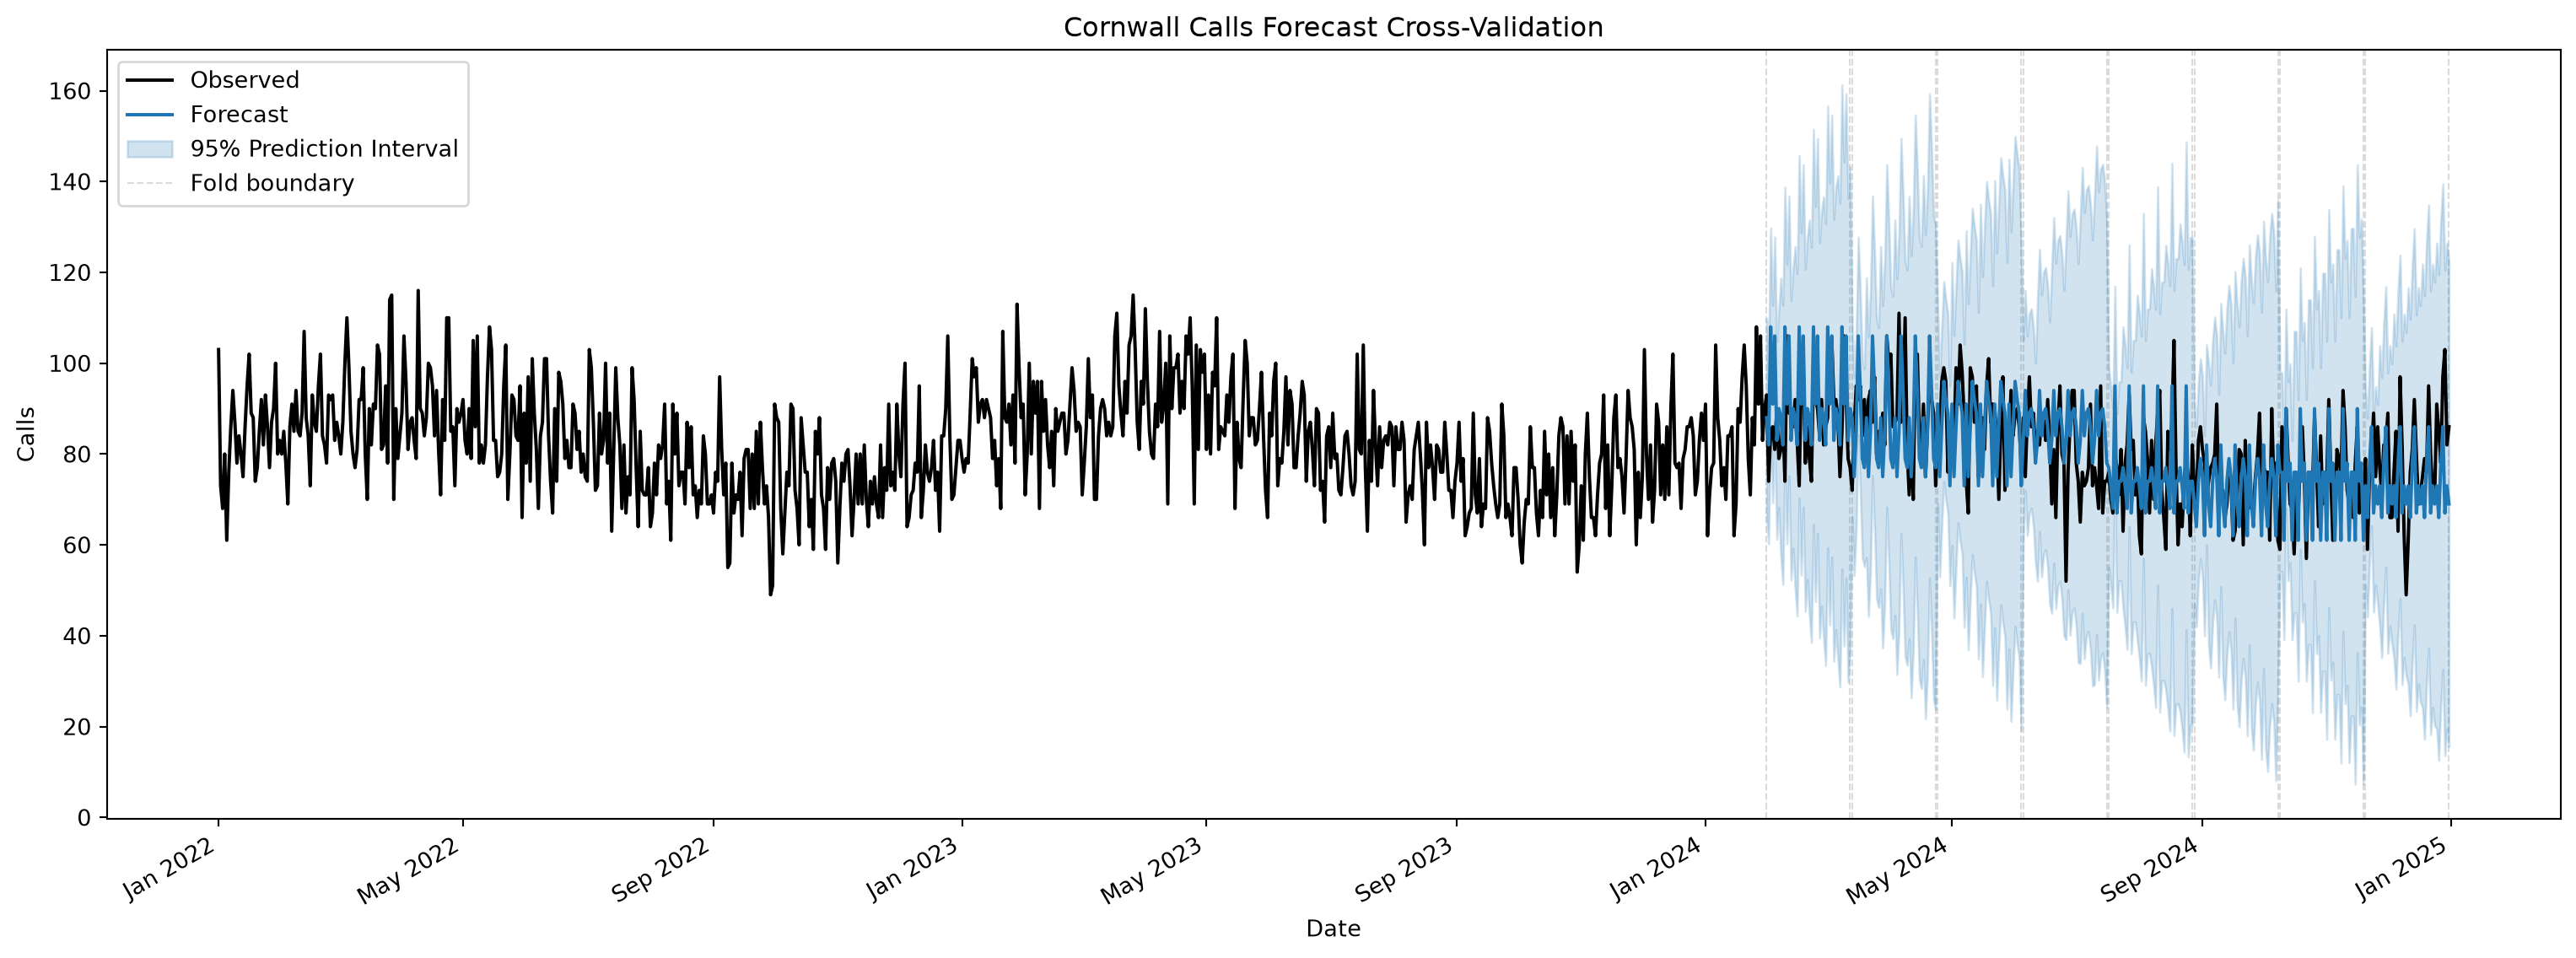
## Example 3: Seasonal-naive cross-validation
``` python
params = SNaiveParams()
forecast = run_cross_validation(
forecast_function=snaive,
historic=df_historic,
params=params,
horizon=42,
step=42,
min_train=365*2,
cores=1
)
plot_cross_validation(
historic=df_historic,
forecast=forecast,
metric="Calls",
area="Cornwall"
)
```
Running 9 series across 8 folds (72 forecasts) using 1 worker(s).
Cross-validation completed in 0 minute(s) and 1 second(s).

## Example 3: Seasonal-naive cross-validation
``` python
params = SNaiveParams()
forecast = run_cross_validation(
forecast_function=snaive,
historic=df_historic,
params=params,
horizon=42,
step=42,
min_train=365*2,
cores=1
)
plot_cross_validation(
historic=df_historic,
forecast=forecast,
metric="Calls",
area="Cornwall"
)
```
Running 9 series across 8 folds (72 forecasts) using 1 worker(s).
Cross-validation completed in 0 minute(s) and 1 second(s).
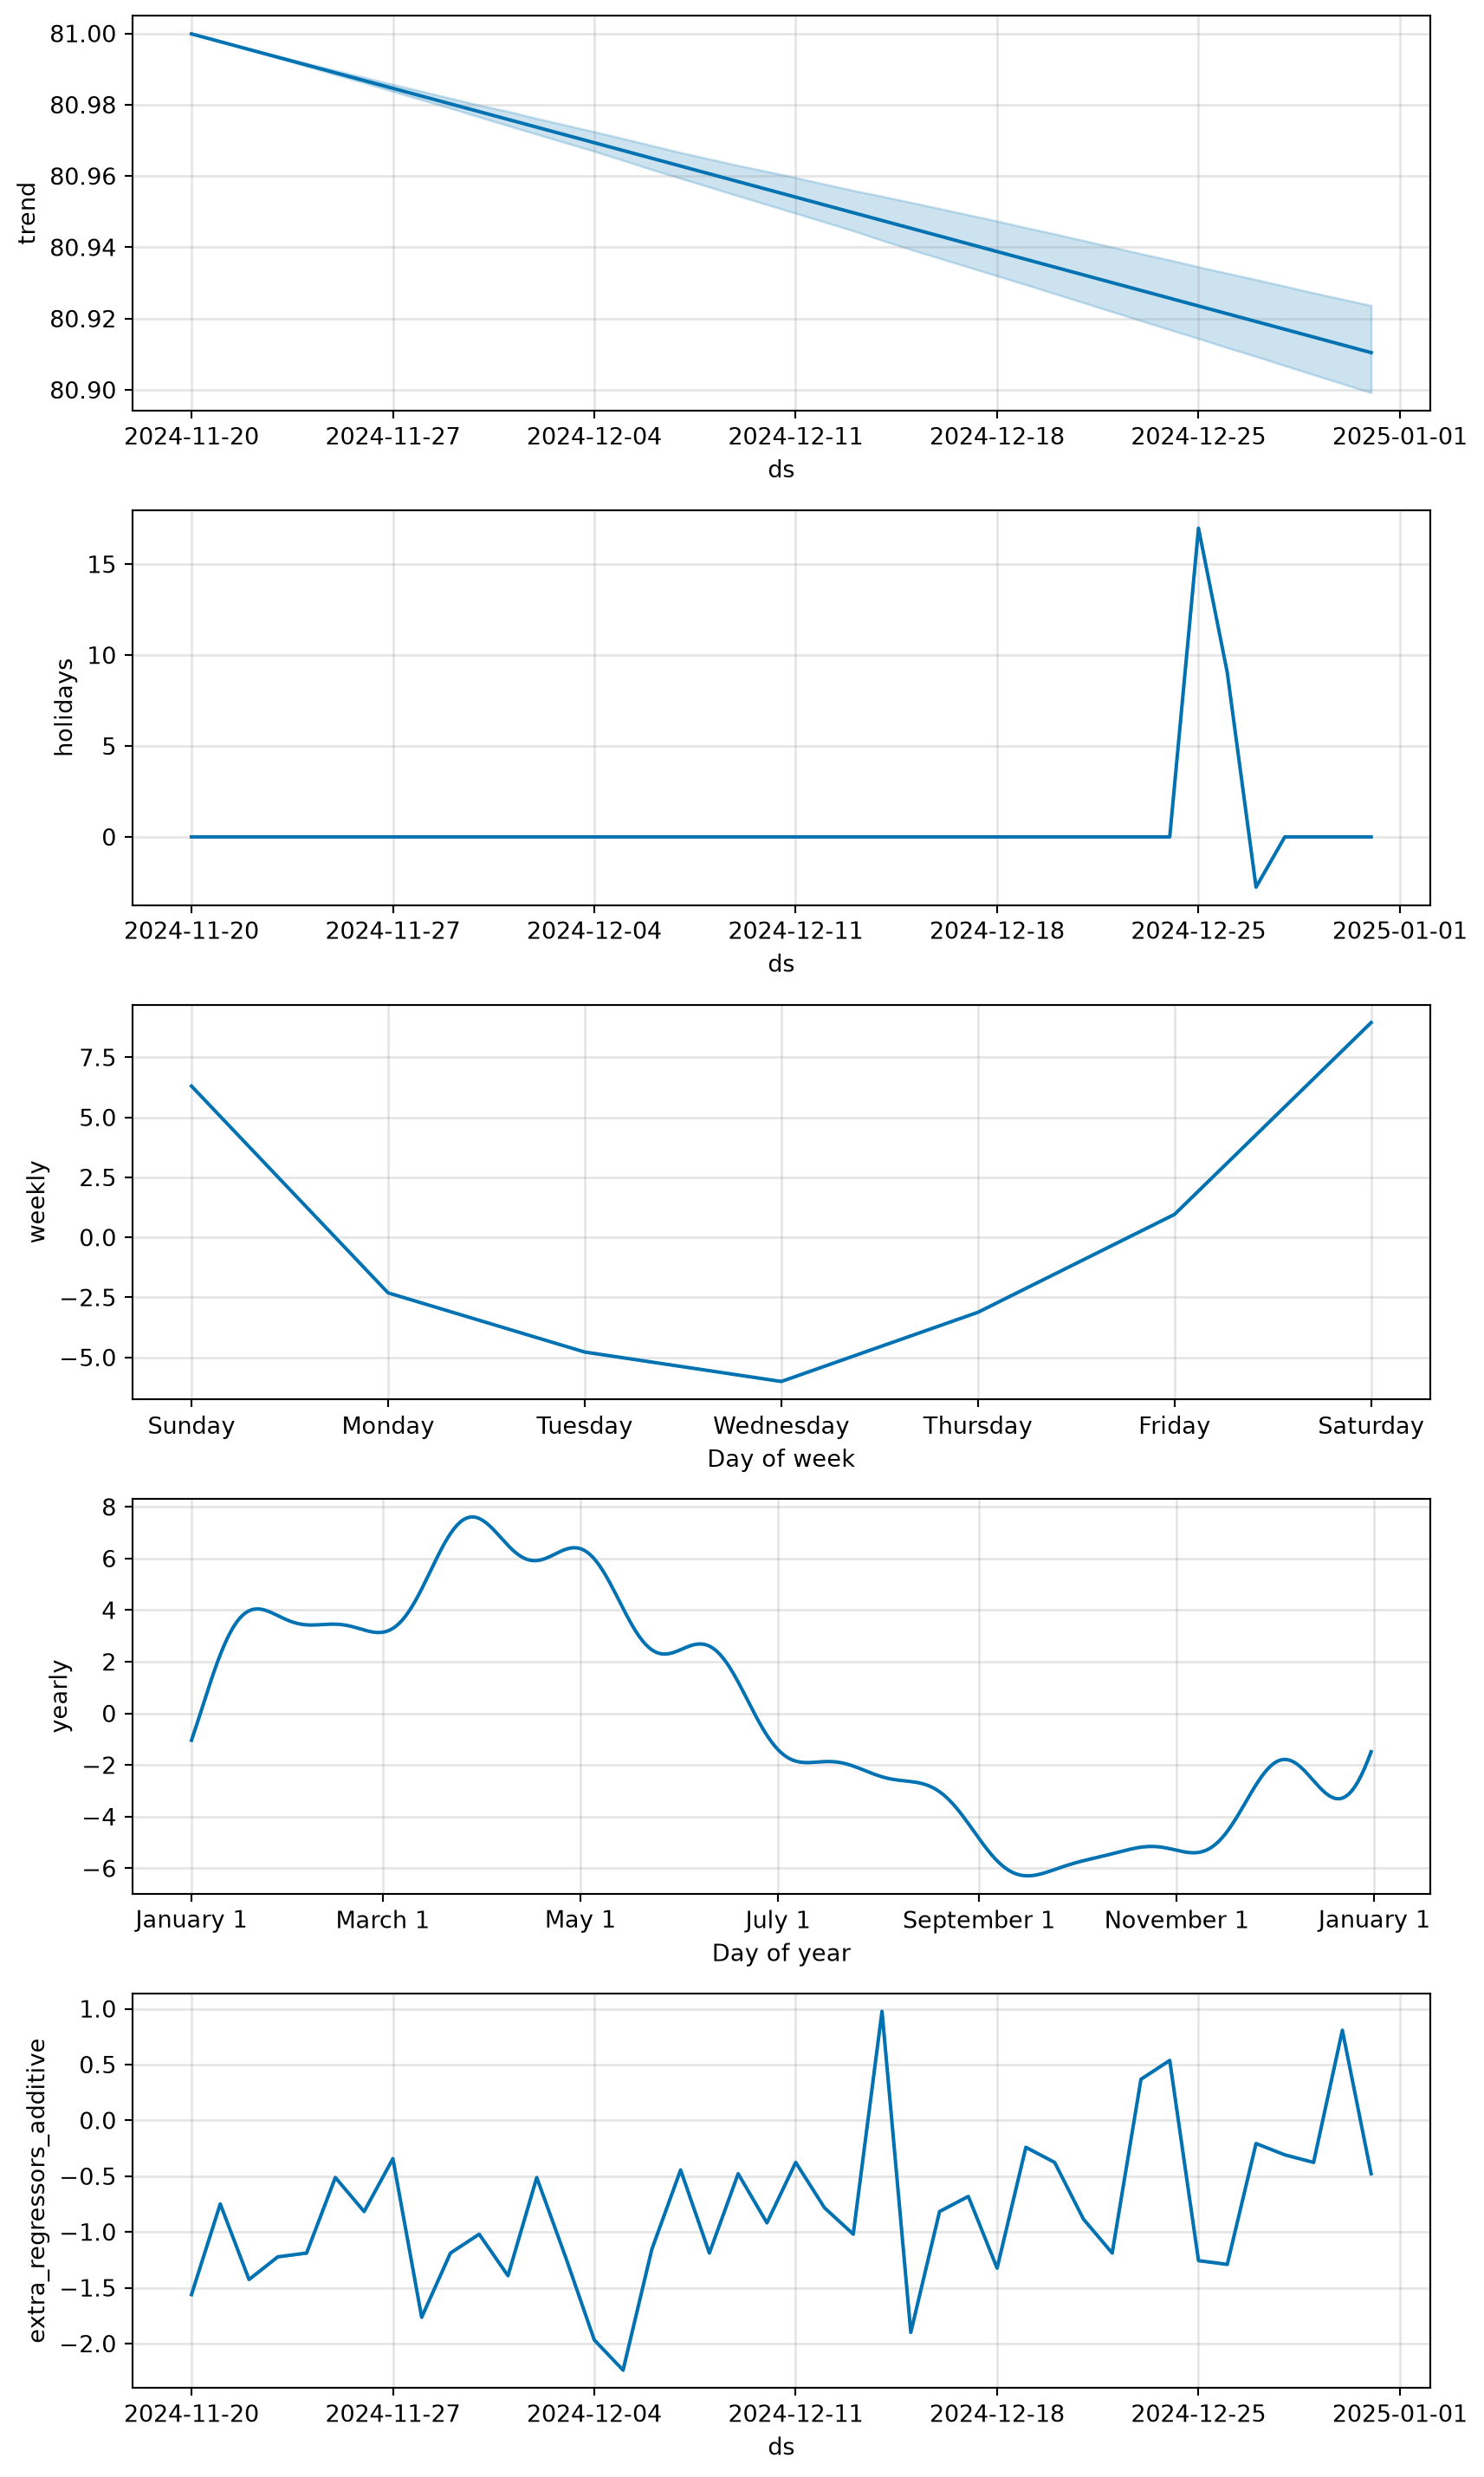
## Example 4: Prophet with additional regressors
``` python
params = ProphetParams(
holidays=df_holidays,
regressors=(
ProphetRegressor(
name="MAX_AIR_TEMP",
data=temp
),
),
plot_components=True
)
forecast = run_single_forecast(
forecast_function=prophet,
train=train,
params=params,
metric="Calls",
area="Cornwall",
test=test
)
calculate_errors(forecast=forecast)
```
| | metric | area | forecast_start_date | horizon | rmse | mase | smape | coverage |
|----|----|----|----|----|----|----|----|----|
| 0 | Calls | Cornwall | 2024-11-20 | 7 | 8.779801 | 0.715186 | 9.513821 | 1.000000 |
| 1 | Calls | Cornwall | 2024-11-20 | 14 | 7.507202 | 0.632459 | 8.396045 | 1.000000 |
| 2 | Calls | Cornwall | 2024-11-20 | 21 | 9.909213 | 0.810898 | 11.103226 | 0.857143 |
| 3 | Calls | Cornwall | 2024-11-20 | 28 | 8.973510 | 0.711588 | 9.738254 | 0.892857 |
| 4 | Calls | Cornwall | 2024-11-20 | 35 | 8.311624 | 0.654961 | 8.867668 | 0.914286 |
| 5 | Calls | Cornwall | 2024-11-20 | 42 | 8.479519 | 0.668057 | 8.784701 | 0.904762 |

## Example 4: Prophet with additional regressors
``` python
params = ProphetParams(
holidays=df_holidays,
regressors=(
ProphetRegressor(
name="MAX_AIR_TEMP",
data=temp
),
),
plot_components=True
)
forecast = run_single_forecast(
forecast_function=prophet,
train=train,
params=params,
metric="Calls",
area="Cornwall",
test=test
)
calculate_errors(forecast=forecast)
```
| | metric | area | forecast_start_date | horizon | rmse | mase | smape | coverage |
|----|----|----|----|----|----|----|----|----|
| 0 | Calls | Cornwall | 2024-11-20 | 7 | 8.779801 | 0.715186 | 9.513821 | 1.000000 |
| 1 | Calls | Cornwall | 2024-11-20 | 14 | 7.507202 | 0.632459 | 8.396045 | 1.000000 |
| 2 | Calls | Cornwall | 2024-11-20 | 21 | 9.909213 | 0.810898 | 11.103226 | 0.857143 |
| 3 | Calls | Cornwall | 2024-11-20 | 28 | 8.973510 | 0.711588 | 9.738254 | 0.892857 |
| 4 | Calls | Cornwall | 2024-11-20 | 35 | 8.311624 | 0.654961 | 8.867668 | 0.914286 |
| 5 | Calls | Cornwall | 2024-11-20 | 42 | 8.479519 | 0.668057 | 8.784701 | 0.904762 |